Ten Year State and Regional Summary
Deer-Vehicle Crash Information Clearninghouse
Home | About | Research | Products | Data | Resources
Statewide and Upper Midwest Summary of Deer-Vehicle Crash and Related Data from 1993 to 2003
Download the Final Report PDF | DOC
Executive Summary
This document contains a detailed summary and description of the deer-vehicle crash (DVC) problem between 1993 and 2003 in the states of Illinois, Iowa, Michigan, Minnesota, and Wisconsin. Several different types of DVC-related data were obtained from the Department of Transportation, Department of Public Safety and/or the Department of Natural Resources in each of these states. More specifically, the University of Wisconsin Deer-Vehicle Crash Information Clearinghouse (DVCIC) were provided the annual total number of police reported crashes, vehicle-miles-traveled, reported DVCs or animal-vehicle crashes (AVCs) (from Iowa), and DVC/AVC injuries and fatalities. Annual deer population estimates were also obtained from four states and deer carcass removal numbers from three. All of these DVC- or AVC-related data were also combined, where appropriate, to summarize and describe this problem for the Upper Midwest region of the United States. Overall, this document describes the DVC/AVC problem in more detail than generally accomplished by individual states within the United States. A regional summary of this issue has not been attempted in the past.
The proper evaluation and combination of DVC- or AVC-related data requires a complete understanding of the defining criteria for the data used. These criteria can change from year to year and be different from state to state. The criteria are noted, as appropriate, in the figures, tables, and text of this document. The criteria of primary interest include the minimum property damage reporting thresholds year to year in each state, the type of data collected (DVCs or AVCs), how much of the state is summarized within the data (e.g., does it include large cities), and what time period do the deer population estimates represent (pre-hunt or post-hunt). In some cases the data for a particular year in a particular state were also questionable and not used. These reductions in data are noted where appropriate. The general trends in the DVC/AVC data collected from each state and in the region are described in this executive summary. Specific DVC or AVC details about each state and the region can be found in their individual data descriptions, figures, and summaries provided throughout the body of this document. The data used to produce the figures in this report are included in Appendices A-1 to A-6.
Overall, the total number of crashes reported in the Upper Midwest region from 1993 to 2003 has remained relatively stable. Several of the states in the region have experienced a stable or increased level of reported crashes and Iowa’s total has generally decreased. The AVMT has increased steadily in all five states and regionally from 1993 to 2003.
The annual number of reported crashes in the Upper Midwest region has been relatively stable, but the annual number of reported DVCS or AVCs (in Iowa) increased by approximately 21 percent between 1993 and 2003. The regional growth in reported DVCs/AVCs was relatively quick from 1993 to 1995 and then at a slower rate from 1995 to 2003. The reported DVC/AVC trends in each state, however, were somewhat different than that shown by a combination of the data for the region. For example, the number of reported DVCs/AVCs in Illinois has increased overall and this occurred from 1993 to 1996 in Iowa and Michigan. However, the data from Minnesota shows a decrease in reported DVCs from 1993 to 1997 and then an increase. The number of reported DVCs in Wisconsin, on the other hand, has been relatively stable. In several states there have generally been some time periods in which reported DVCs/AVCs have decreased or been relatively stabile.
The percentage of reported crashes represented by DVCs or AVCs has generally increased or remained stable in each of the five Upper Midwest states considered. In Illinois, Iowa, and Michigan this percentage has increased, but it has been relatively stable in Wisconsin. In Minnesota the percentage of all crashes represented by DVCs decreased from 1993 to 1996 and then increased. Regionally, the DVC/AVC percentage increased from 9.2 to 10.9 percent between 1993 and 2002 (the last year when data from all five states were available). This change represents an increase of approximately 18.5 percent in 10 years.
The annual number of DVC/AVC injuries and fatalities reported in the Upper Midwest region has varied from state to state. In Iowa and Michigan an increase was observed from 1993 to 1997/1998 and then a decrease. In Minnesota the number of DVC/AVC injuries and fatalities has increased from 1993 to 2002. Illinois and Wisconsin have experienced increases from 2000 to 2003 and 1993 to 1994, respectively, but otherwise have reported annually variable or stable data. Overall, the annual number of DVC/AVC fatalities in the regional ranged from 12 to 45 (not including those data excluded and noted in the appropriate figures), and annual DVC/AVC injuries ranged from 3,888 to 5,324.
An annual DVC or AVC rate per HMVMT was calculated for each state and the region from 1993 to 2003. Not surprisingly, statewide DVC/AVC rates generally follow the same pattern as the total number of reported DVCs/AVCs in the state. The DVC rate in Illinois increased from 1993 to 2003, and this also occurred from 1993 to 1996 in Iowa and Michigan. The DVC rate in Minnesota decreased from 1993 to 1997 and was then relatively stable. The rate in Wisconsin remained relatively stable from 1993 to 2003. Regionally, the DVC/AVC crash rate has also remained relatively stable, despite the consistent annual increase in regional AVMT. The stability of this measure (despite the AVMT increase) results from a general increase in reported DVCs/AVCs.
Four states (Iowa, Michigan, Minnesota, and Wisconsin) in the region provided annual deer population estimates, but only three states (Iowa, Minnesota, and Wisconsin) provided data they had collected on their annual carcass removal activities. The annual deer population estimates in three states increased from 1993 to 2003, but the estimates completed in Michigan increased from 1993 to 1995 and then decreased. Regionally, the annual deer population estimates have been relatively cyclical. An increase in this regional measure is shown from 1993 to 1995, a decrease from 1995 to 1997, and then an increase until about 2000 before an apparent decrease. The annual number of carcasses removed from three of the states, on the other hand, has increased from 1993 to 1996 but remained relatively stable from that point. This pattern could be the result of many factors, including program funding and how the carcass removal data was collected and recorded. Each year there are always more carcasses removed (salvageable and unsalvageable) than DVCs/AVCs officially reported. The annual ratio of carcasses to reported DVCs/AVCs ranged from about 1.4 to 1.6 in Iowa, 1.7 to 2.6 in Minnesota, and 1.6 to 2.3 in Wisconsin. The average ratio regionally was about 2.0.
There have been several attempts at a national quantification of the DVC or AVC problem. It has been estimated, for example, that over one million DVCs occur each year in the United States and these collisions cost the traveling public more than a billion dollars (1). The basis of this estimate appears to be a survey in which the responses were based on police-reported DVC data, roadside carcass data, or some combination of the two. These two datasets can have different defining criteria and their combination to estimate the problem in the United States may not be appropriate. It has also been estimated that the percentage of total crashes represented by AVCs increased from 4.7 percent in 1985 to 8.2 percent in 1991 (8). Between 1994 and 2004 the number of annual AVC fatalities in the United States also increased from 131 (in 1994) to 204 (in 2004), representing a 56 percent increase (11). Finally, the United States Centers for Disease Control and Prevention (CDC) estimated that in 2001 and 2002 AVCs resulted in 26,647 people being non-fatally injured and visiting the hospital.
The recommendations included in the last section of this document focus on improvements in the collection and combination of DVC or AVC data. It is recommended, for example, that the defining criteria and type of DVC/AVC-related data be documented for the entire United States. The time period evaluated should also be expanded to include annual data from pre-1993 and post-2003. It is also recommended that the bureaus or agencies that are collecting DVC/AVC-related data in each state be identified and that one person be assigned the task of obtaining and/or summarizing these data each year. A multi-disciplinary and public-private agency committee or coalition could also be created to consistently educate the driving public about this subject. Finally, it is also recommended that the value, collection, and use of carcass removal data and the police-report details of DVCs/AVCs be investigated further. Among other things, more specific information about carcass removal activities could change how the magnitude of the DVC/AVC problem is defined and where DVC/AVC countermeasures are considered. In addition, a closer examination of DVC/AVC reports may better explain the trends seen in this report. This report concludes with a recommendation that the type and origin of the DVC/AVC-related data used in papers and articles on this subject generally need to be more properly defined in the future. Confusion on this point, in some cases, has limited the value of DVC/AVC-related documents in the past.
Illinois Data
10-Year Report: This report used only a portion of the data available from Illinois. To view all Illinois data, including the most recent data available, please visit the Animal-Vehicle Crash Data page.
Illinois Data Summary
Overall, from 2000 to 2003, DVCs represented approximately 5.2 percent of all the crashes reported and summarized in Illinois. The total number of DVCs has also increased during the last decade. An evaluation of the Illinois DVC-related data showed the following general patterns:
- The annual total number of crashes reported and summarized in Illinois has generally increased throughout the decade, but appears to have decreased somewhat from 2000 to 2003 (See Figure 1). The AVMT in Illinois has consistently increased during the study time period (See Figure 2).
- There was an increasing trend in the annual number of DVCs reported in Illinois for the years summarized (See Figure 3). The number of DVCs reported ranged from 16,504 to 25,660 during this time period (a 55.5 percent increase). The increase in reported DVCs from 2000 to 2003 was 30.0 percent. The percentage of total crashes represented by DVCs has also increased (See Figure 4). From 2000 to 2003 this measure increased from 4.29 to 5.87 percent.
- The annual number of fatalities due to DVCs ranged from 1 to 6 between 1993 and 2003. There were a total of 36 DVC fatalities during these 11 years. The number of injuries due to DVCs ranged from 778 to 1,245 for those years in which all non-fatal DVCs in Illinois were summarized (i.e., 1993 to 1995 and 2000 to 2003). The number of fatalities and injuries during the last decade appear to vary from year to year with an increase from 2000 to 2003 (See Figure 5).
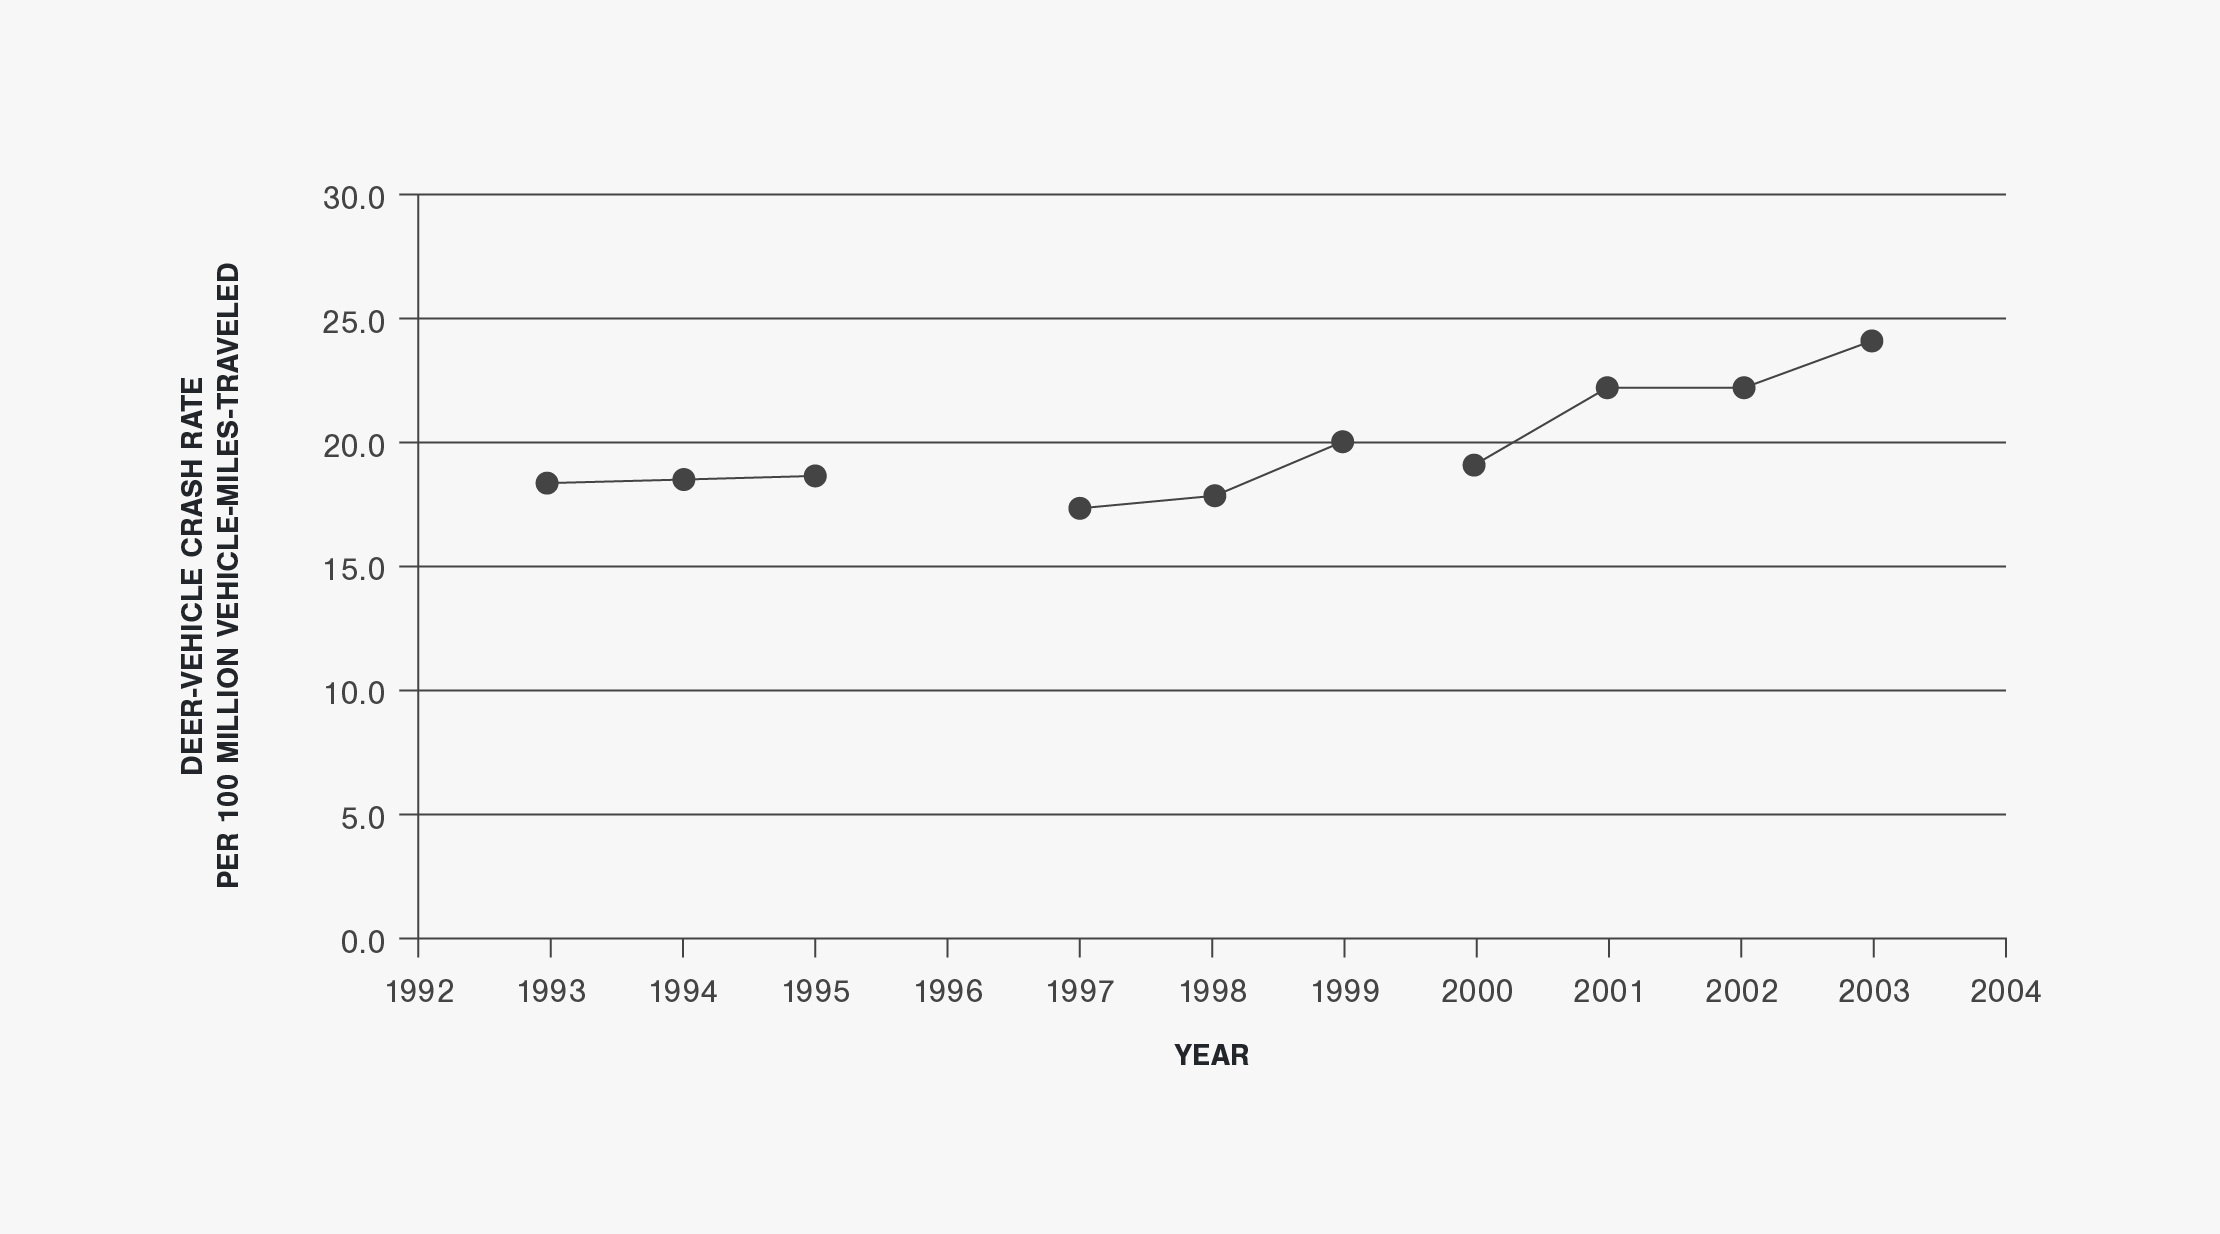
- The DVC rate (i.e., the number of DVCs per HMVMT) has also increased from 1993 to 2003 despite the constant increase in AVMT. This measure has ranged from 18.4 DVCs per HMVMT in 1993 to 24.1 DVCs per HMVMT in 2003 (a total increase of about 31 percent).
Figures
Figure 1 | Total Crashes Reported in Illinois (1993 to 2003)
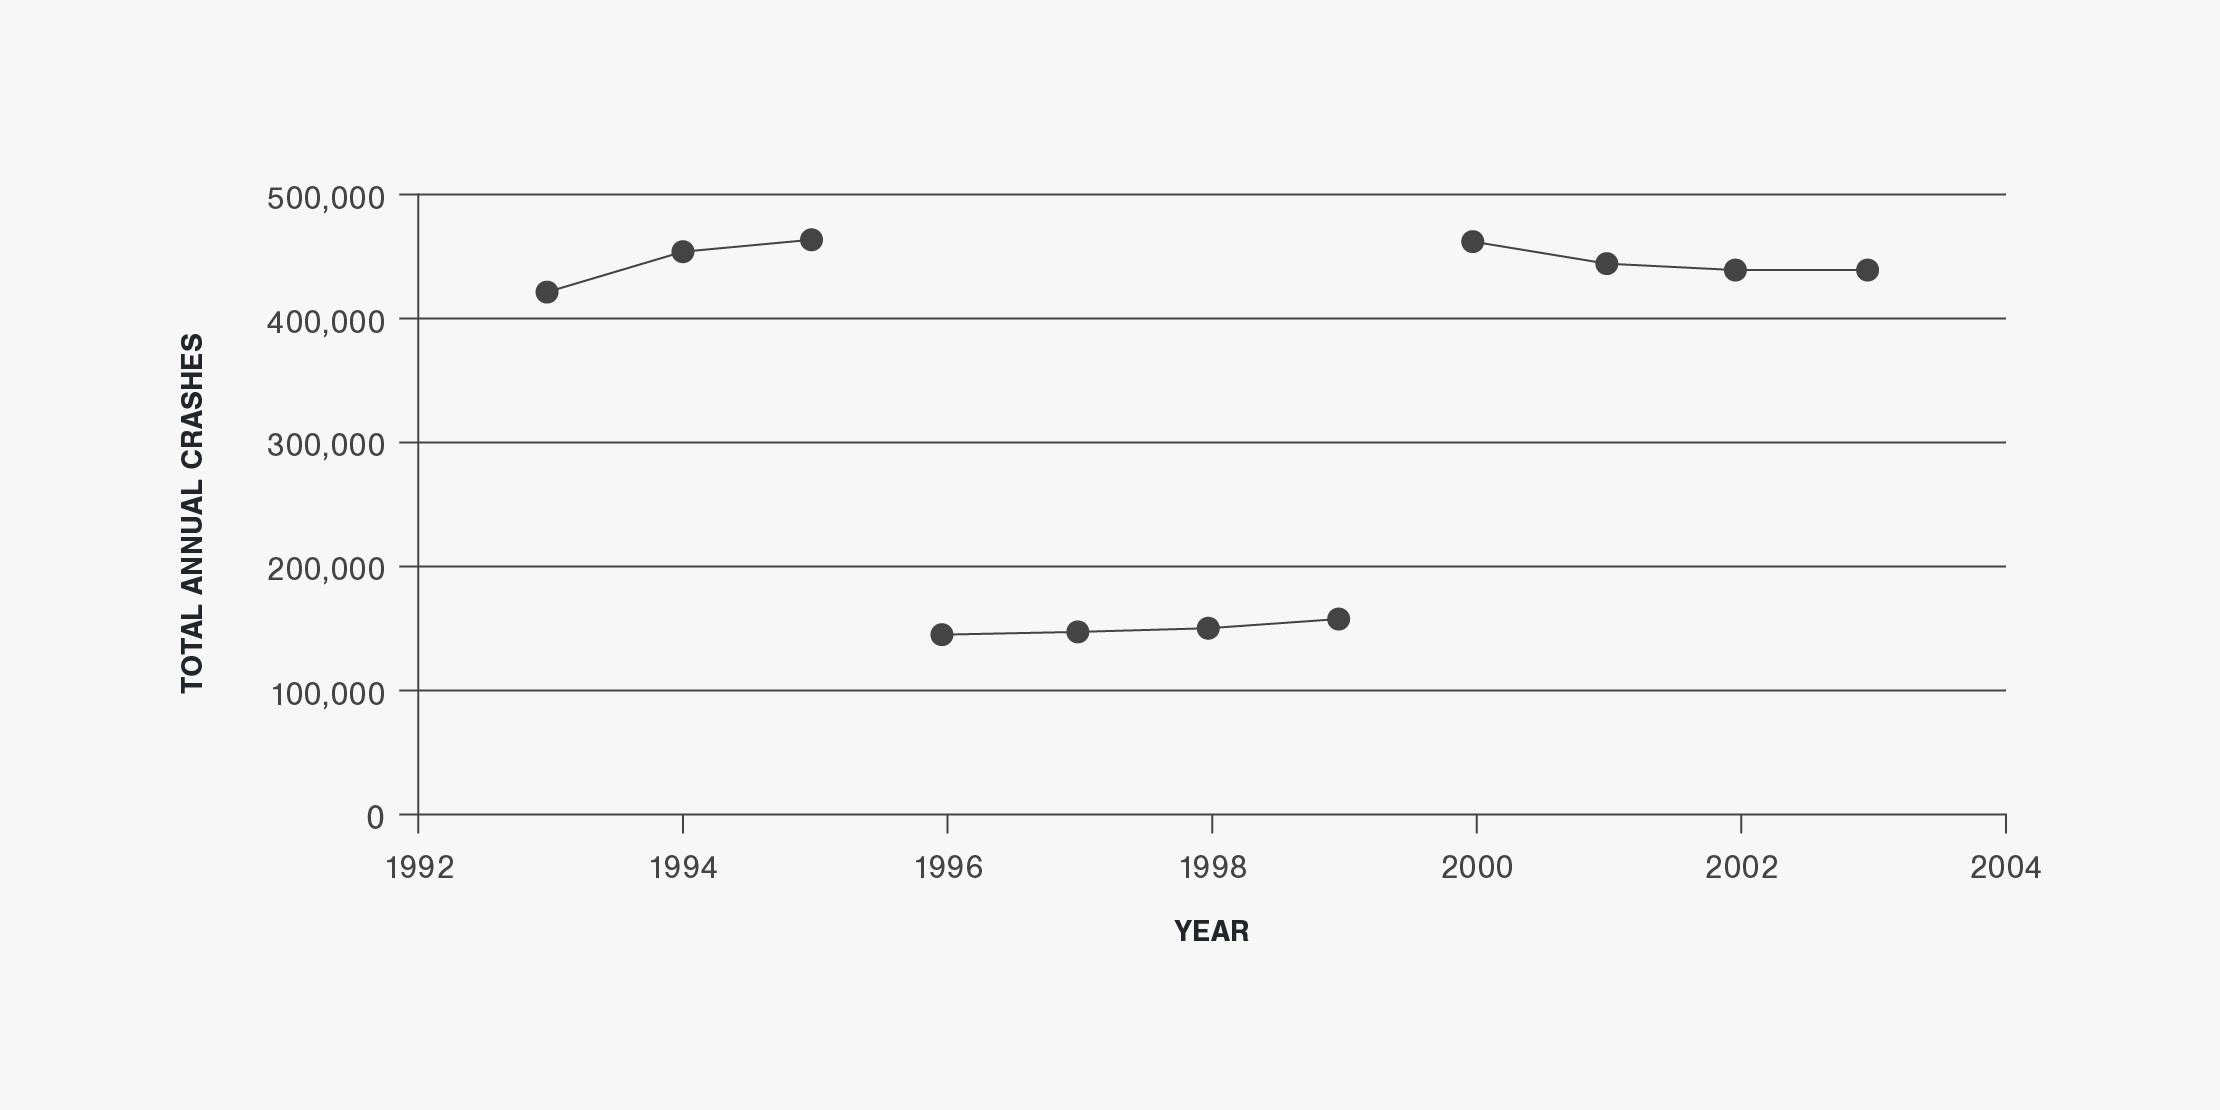
Figure 2 | Annual-Vehicle-Miles-Traveled in Illinois (1993 to 2003)
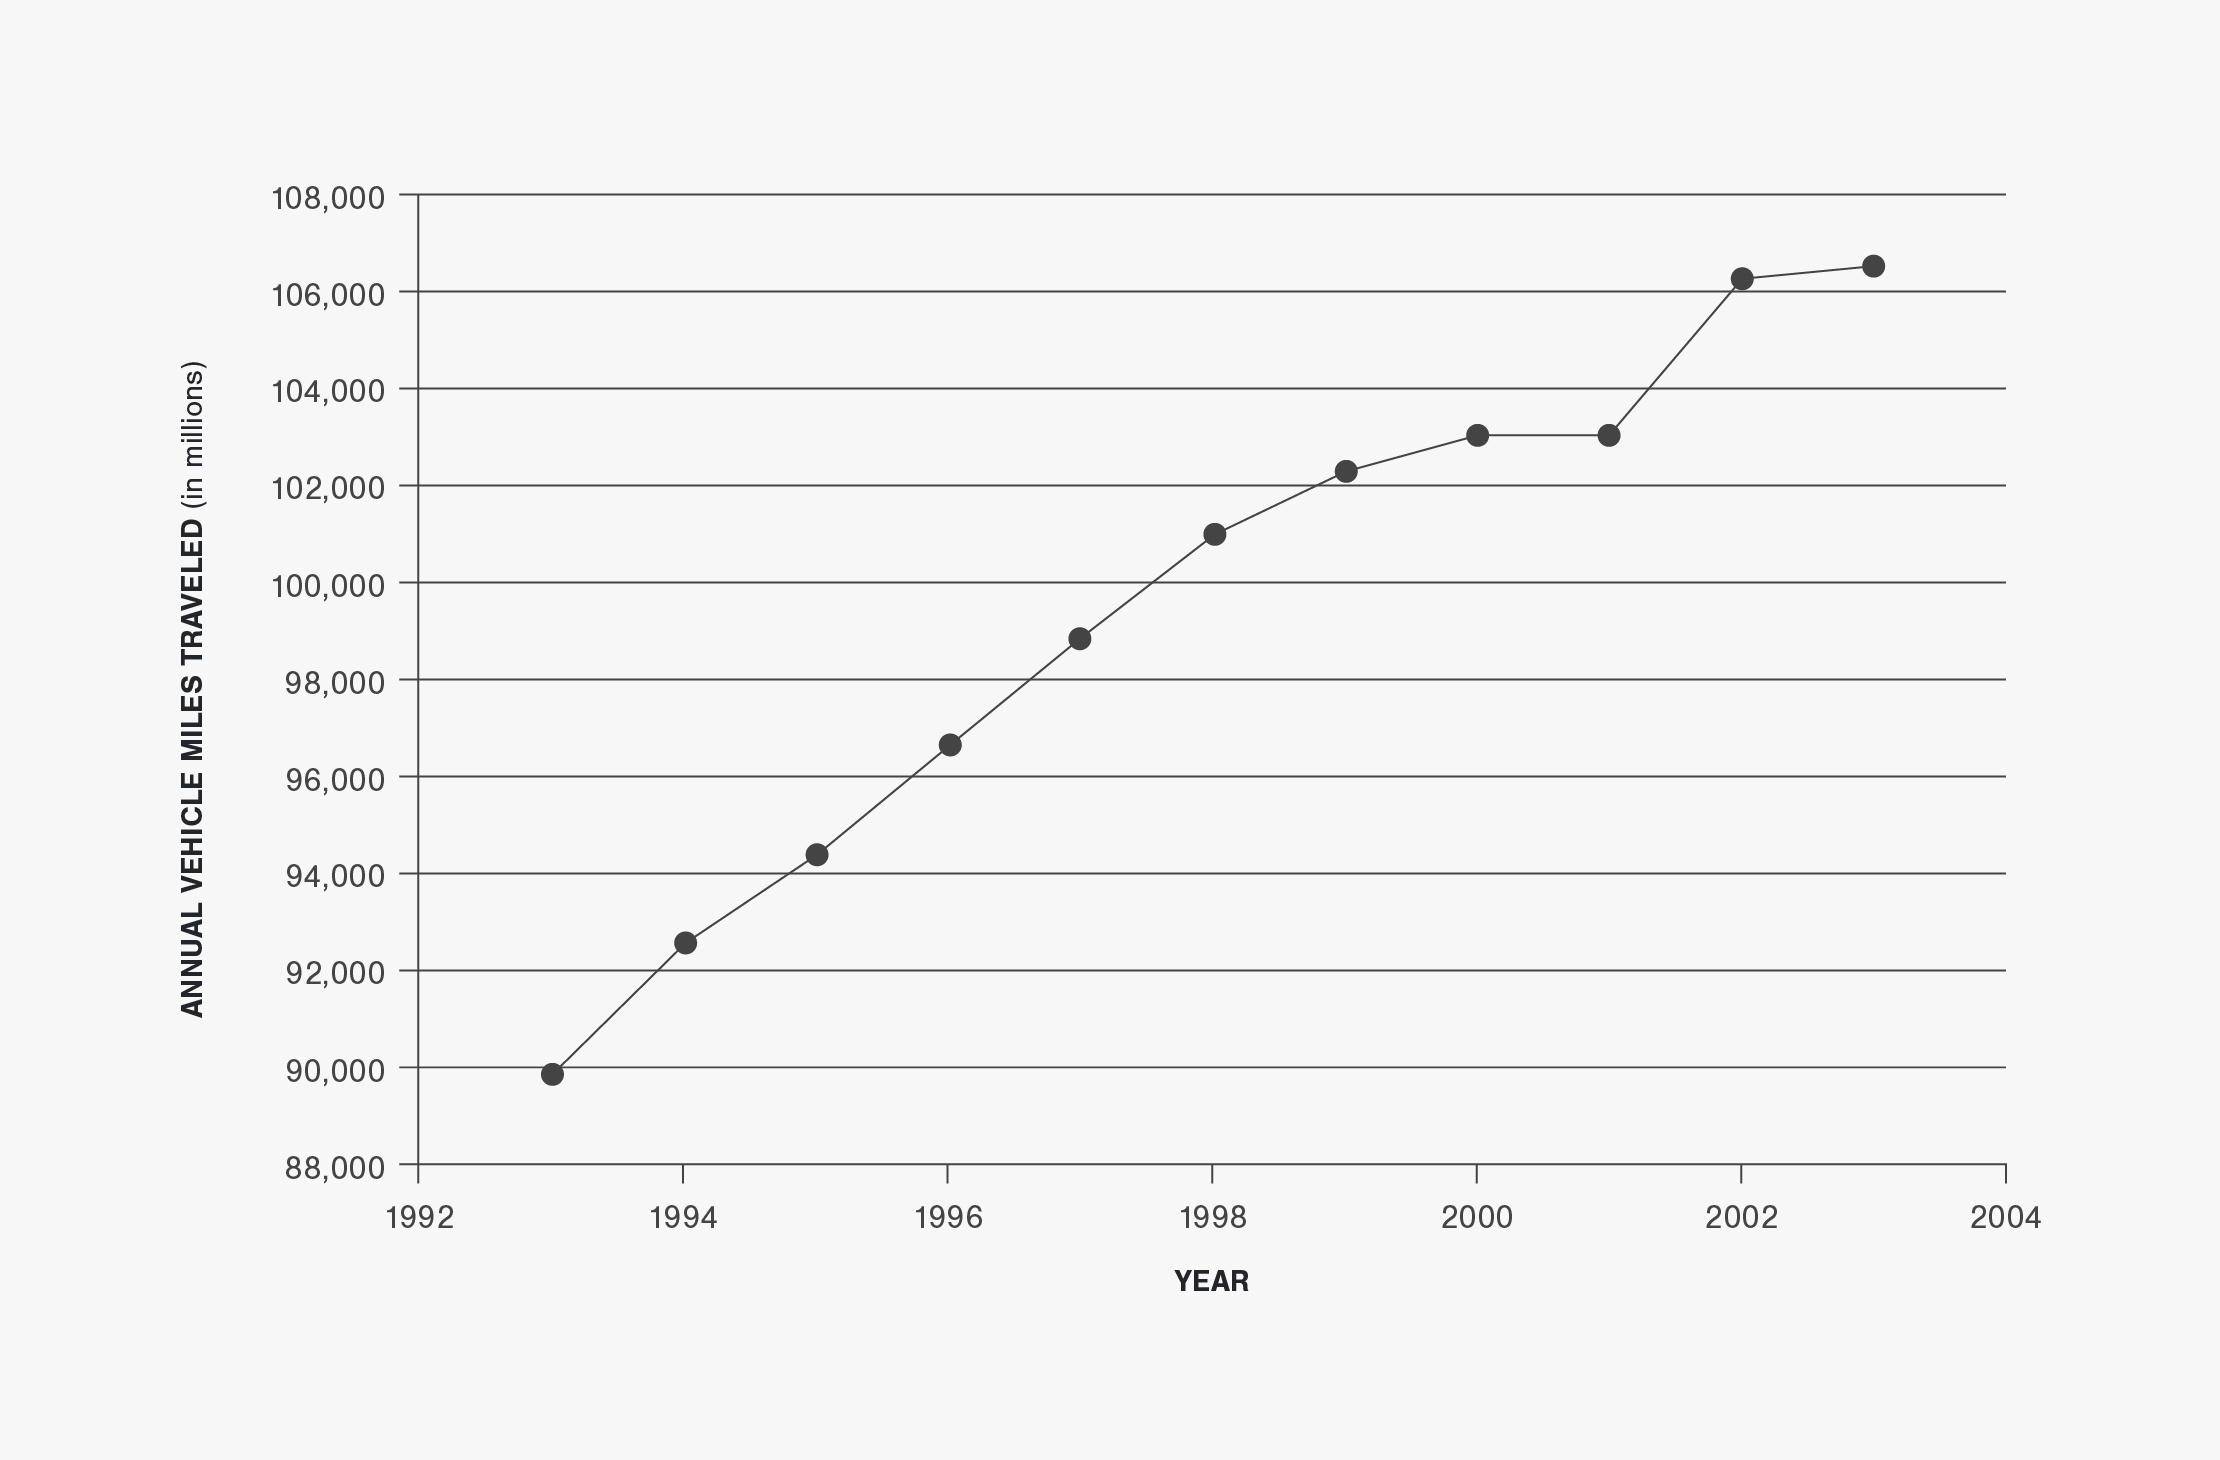
Figure 3 | Reported Deer-Vehicle Crashes in Illinois (1993 to 2003)
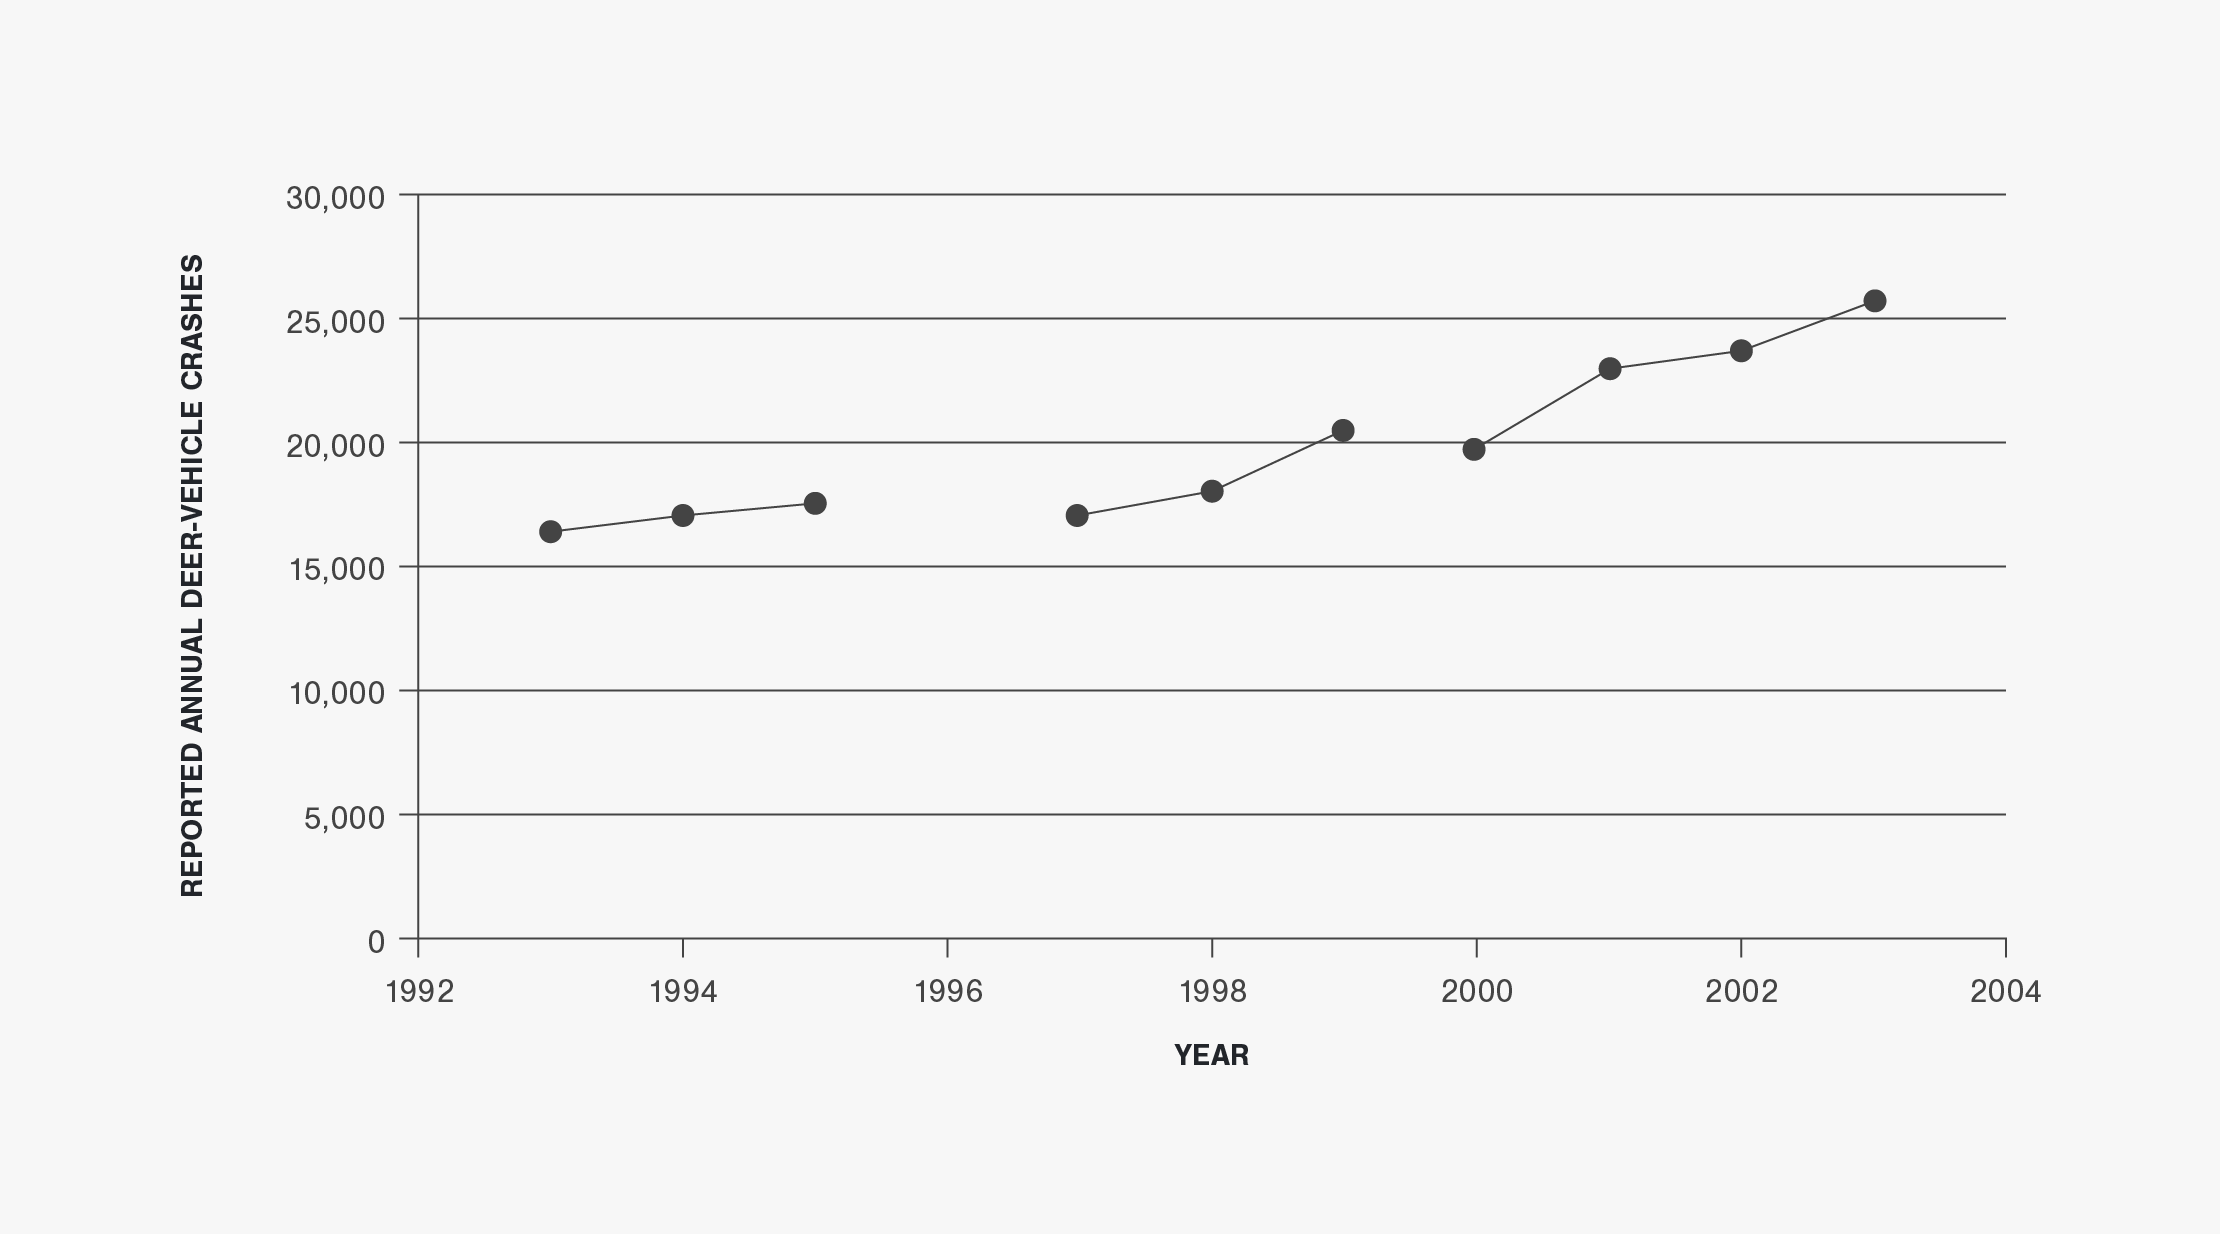
Figure 4 | Percent Deer-Vehicle Crashes in Illinois (1993 to 2003)
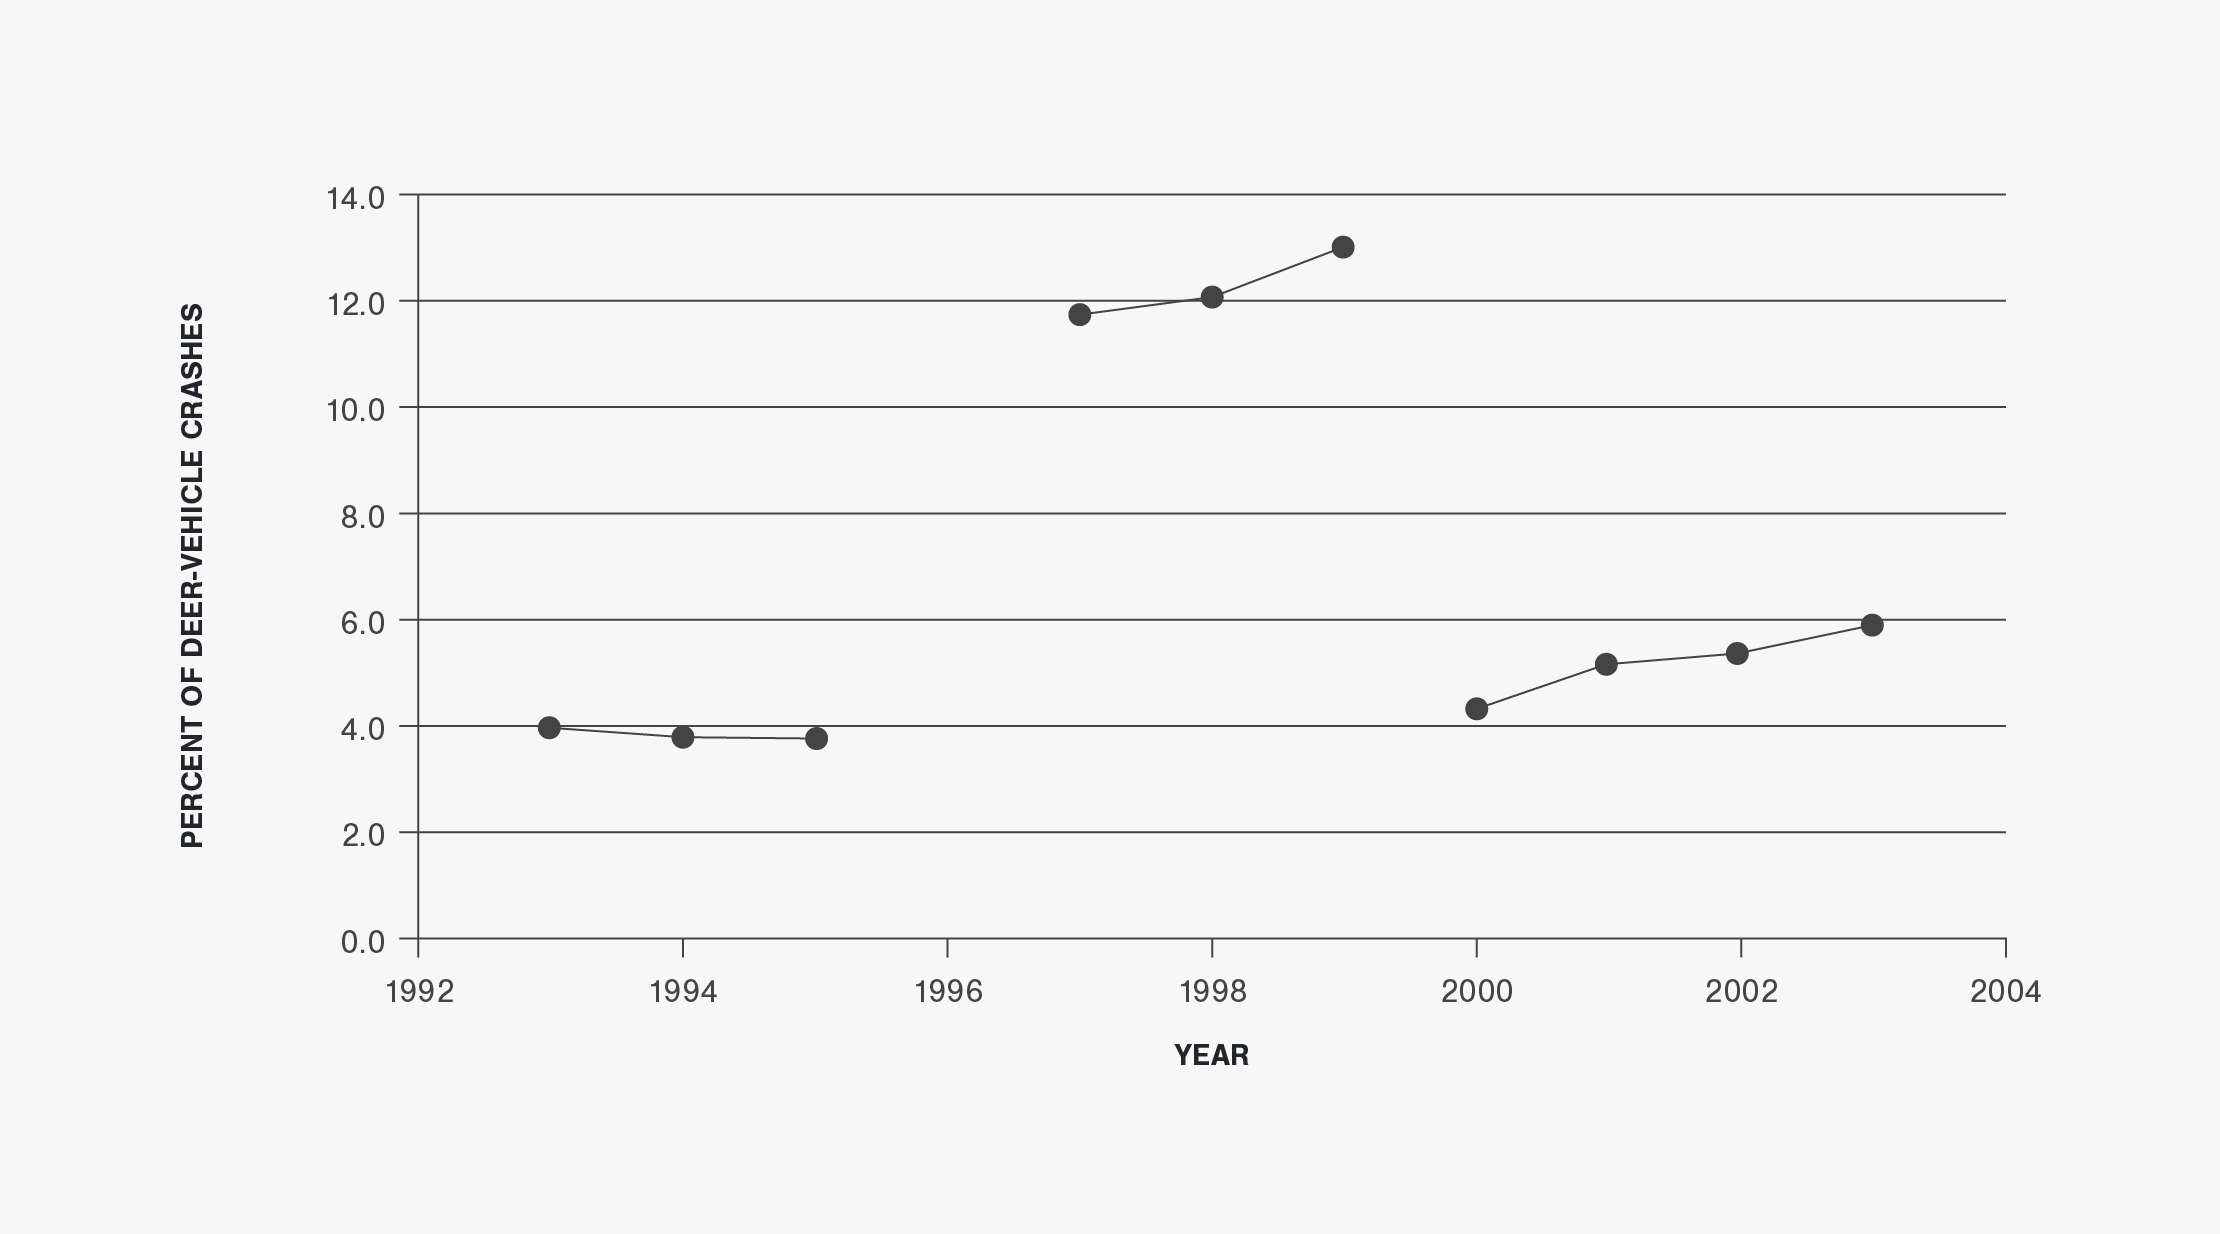
Figure 5 | Number of Deer-Vehicle Crash Fatalities and Injuries in Illinois (1993 to 2003)
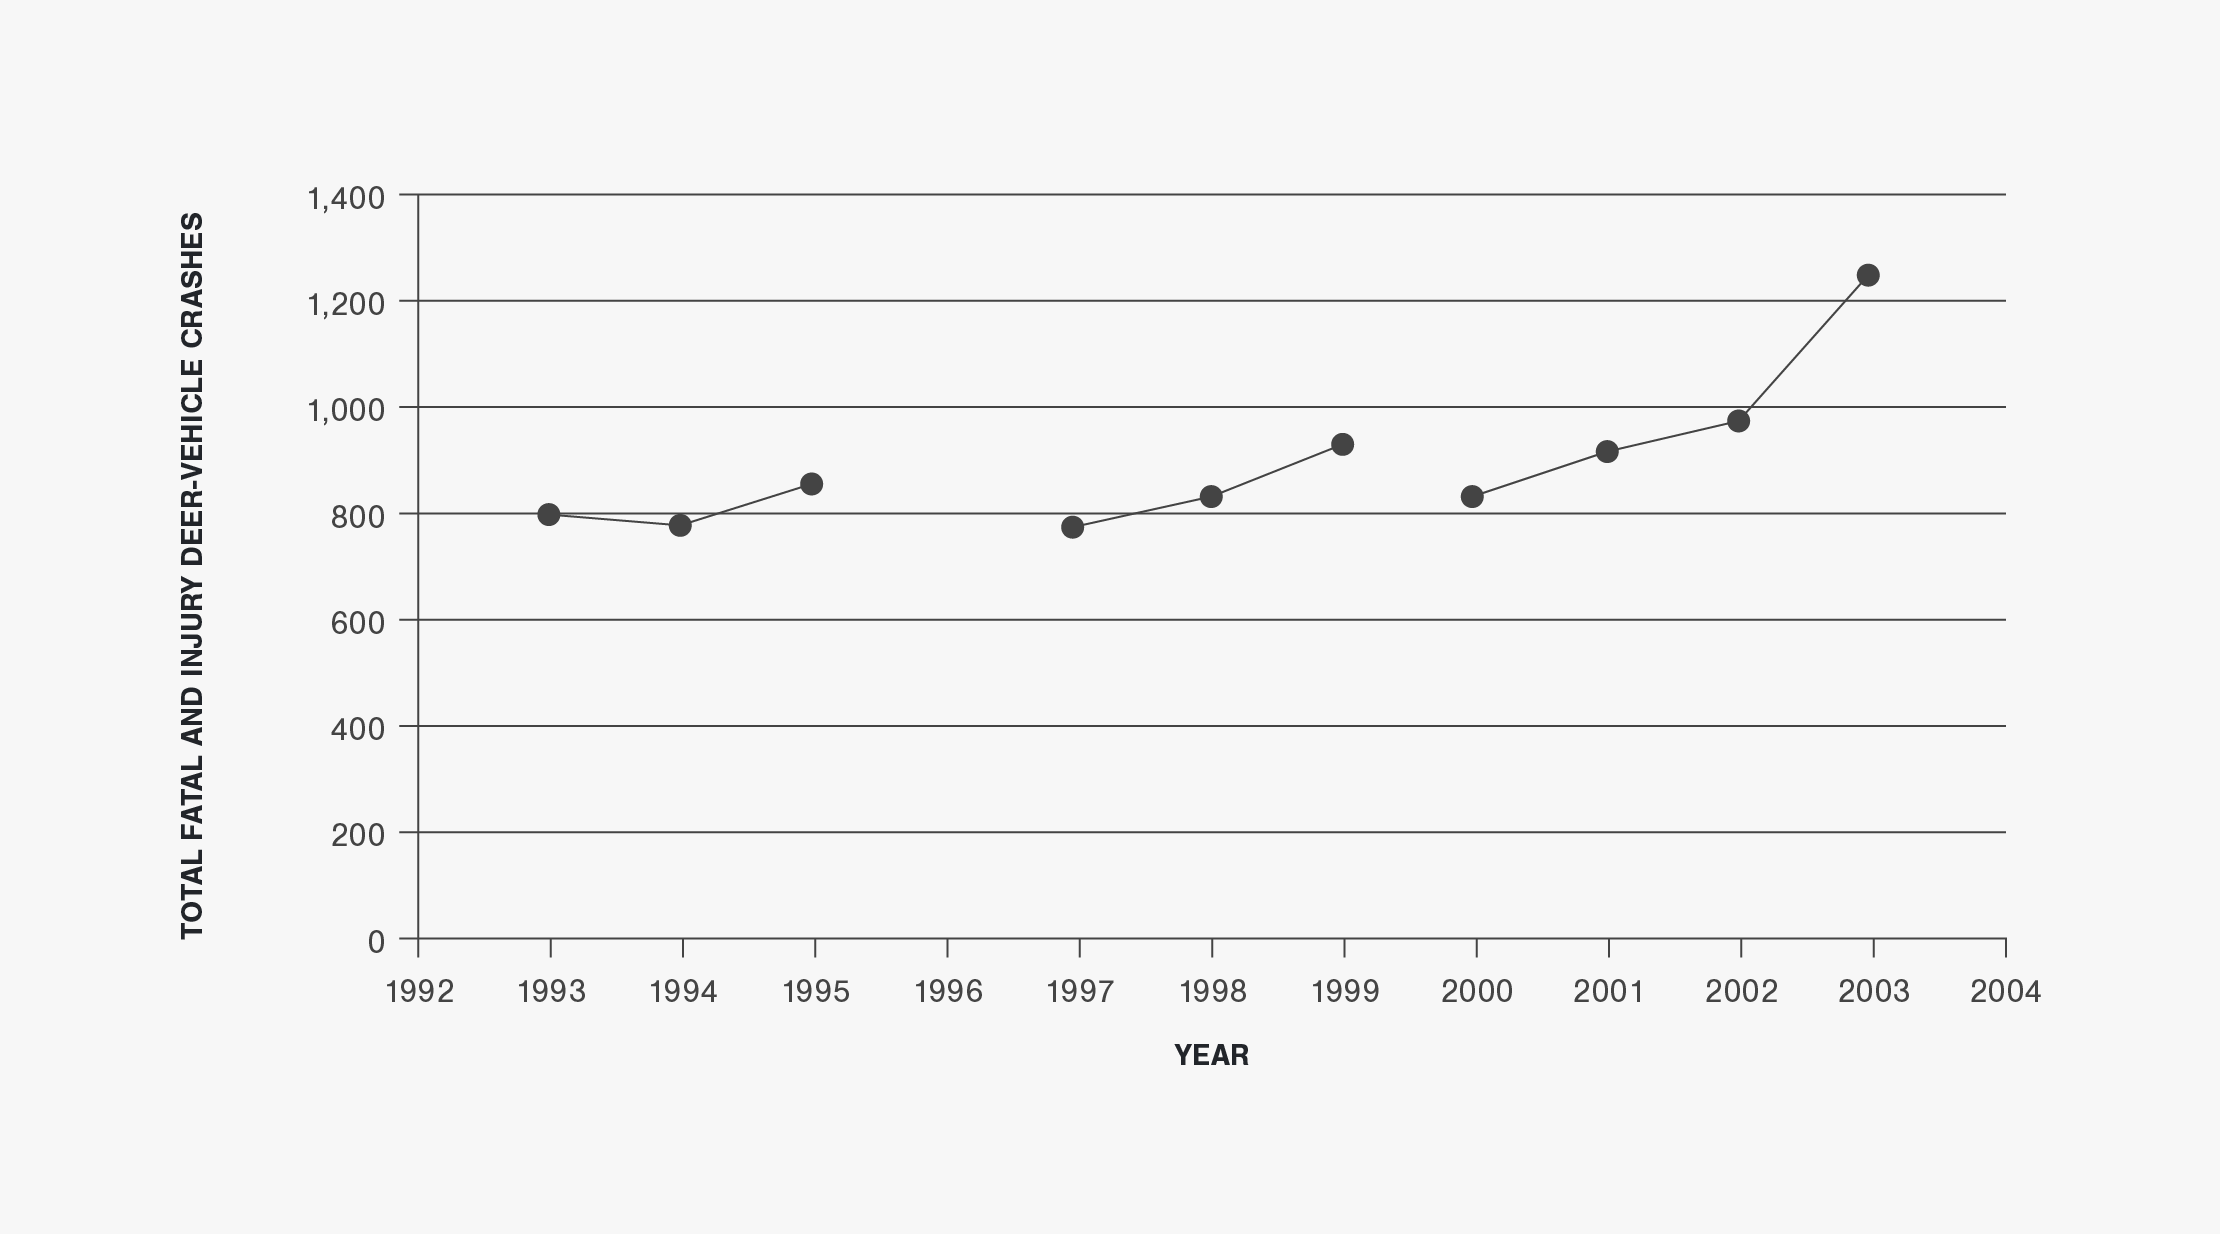
Figure 6 | Deer-Vehicle Crash Rate per 100 Million Vehicle-Miles-Traveled in Illinois (1993 to 2003)
Illinois Data Table
Table A-1 | Illinois Deer-Vehicle Crash and Related Data (1993 to 2003)
a Data from 1996 excluded due to inconsistent data summary during that year.
b Crash data from 1996 to 1999 does not include non-fatal crashes reported within the City of Chicago.
Iowa Data
10-Year Report: This report used only a portion of the data available from Iowa. To view all Iowa data, including the most recent data available, please visit the Animal-Vehicle Crash Data page.
Iowa Data Summary
From 1993 to 2000 the average percentage of all crashes reported in Iowa that were AVCs was approximately 11.6 percent. However, the annual total number of reported AVCs increased from 1993 to 1996, decreased until 2000, and then increased from there to 2002/2003. An evaluation of the Iowa AVC-related data showed the following general patterns:
- The annual total number of crashes reported and summarized in Iowa has generally decreased from 1993 to 2003 (See Figure 1). The total annual number of reported crashes was greatest in 1996 at 78,360, but only 59,190 in 2003. The AVMT in Iowa has consistently increased during the study time period (See Figure 2).
- There was an increasing trend in the annual number of AVCs reported in Iowa from 1993 to 1996, a decreasing trend from 1996 to 2000, and an increase from 2000 to 2002/2003 (See Figure 3). However, the percentage of total crashes represented by AVCs has generally increased from 9.5 to 14.2 percent (See Figure 4).
- The annual number of injuries and fatalities due to AVCs ranged from 461 to 888 between 1993 and 2003. There were a total of 30 AVC fatalities during these 11 years. The number of injuries and fatalities due to AVCs increased dramatically from 1993 to 1997 and decreased from 1997 to 2003.
- The AVC rate (i.e., the number of AVCs per HMVMT) increased from 1993 to 1996 and then generally decreased from 1997 to 2003. This measure peaked at 31.5 AVCs per HMVMT in 1996 and was at 26.7 AVCs per HMVMT in 2003.
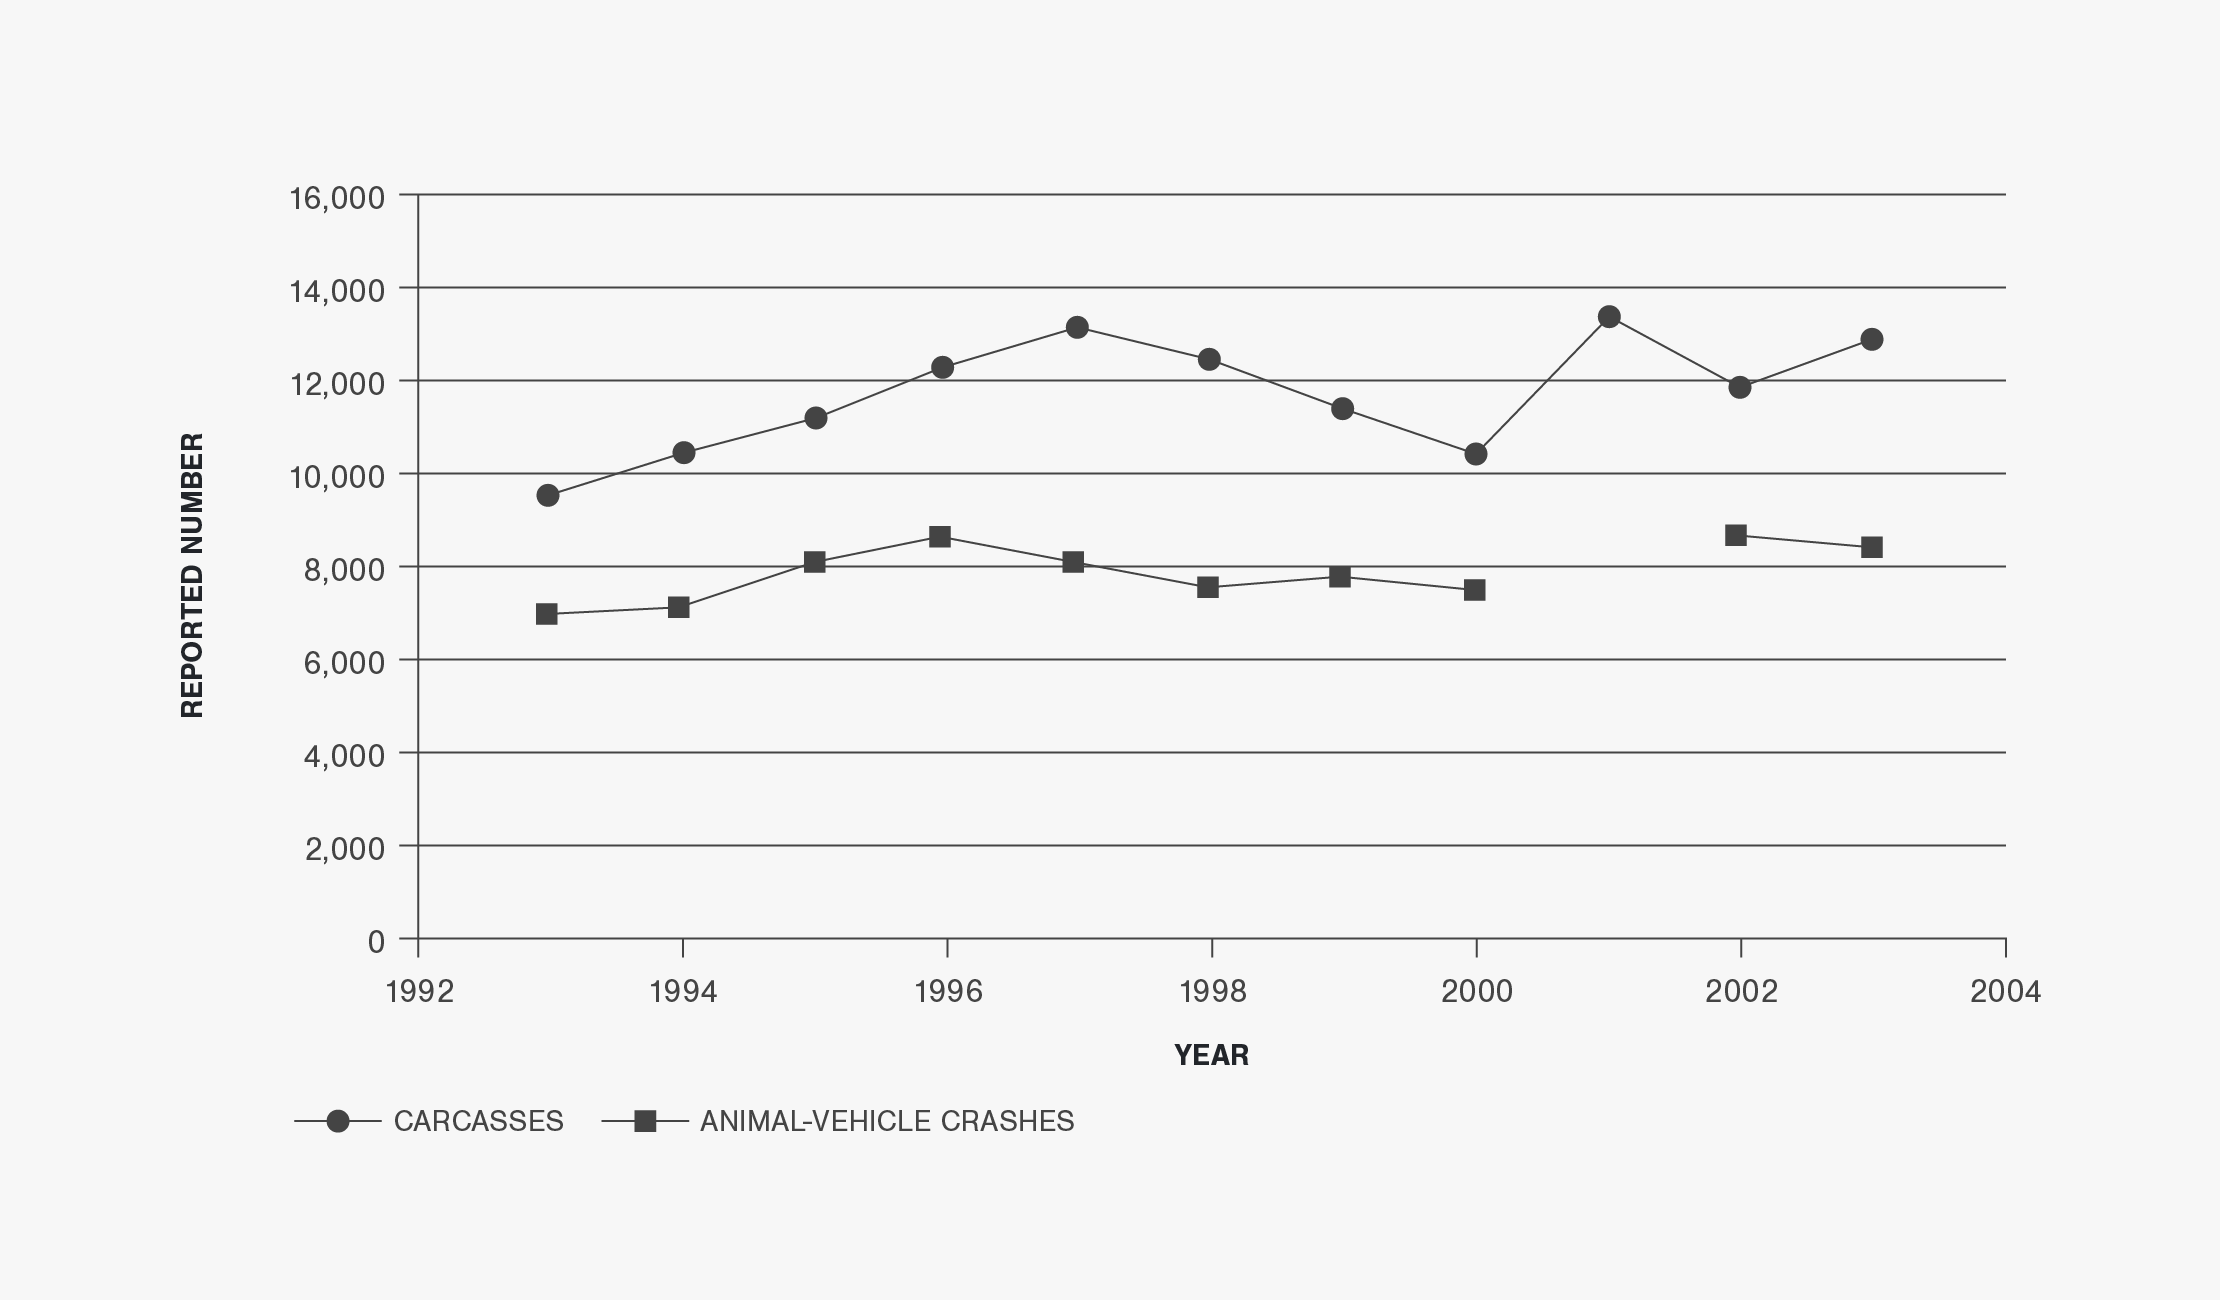
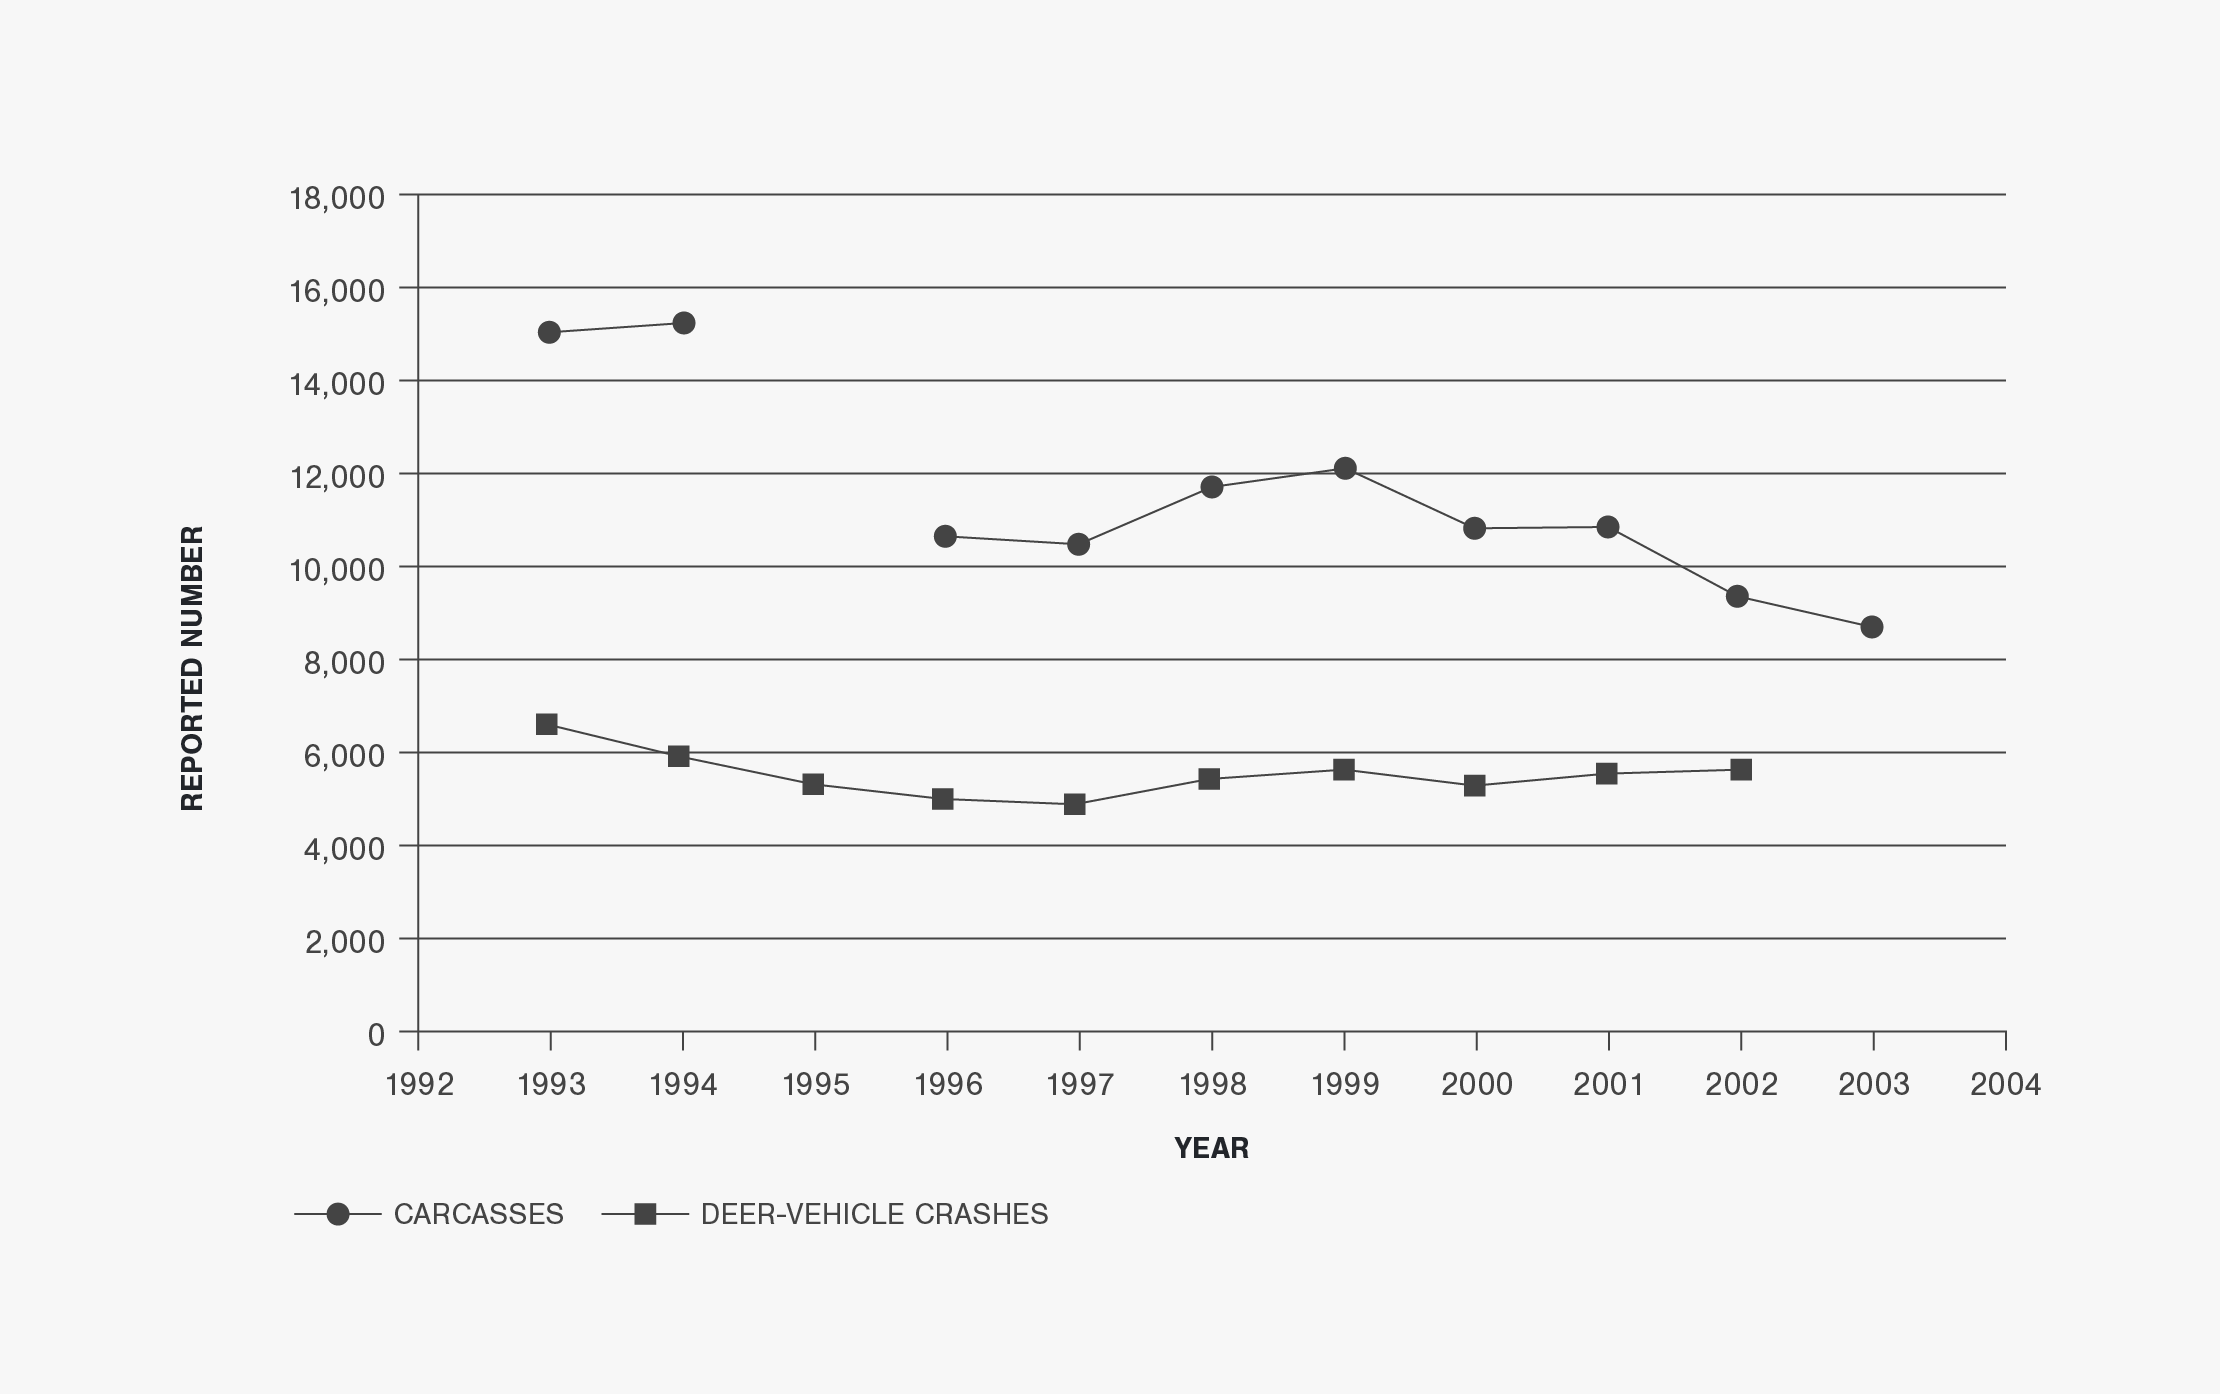
- Iowa also provided annual deer population estimates and annual carcass removal numbers from 1993 to 2003. Figure 7 shows that the annual deer population estimates have increased from 198,589 in 1993 to 315,809 in 2003 (a 59 percent increase). The number of carcasses removed from the roadside, on the other hand, has been approximately 1.4 to 1.6 times greater than the number of AVCs reported annually. This difference has varied from year to year (See Figure 8).
Figures
Figure 1 | Total crashes reported in Iowa (1993 to 2003)
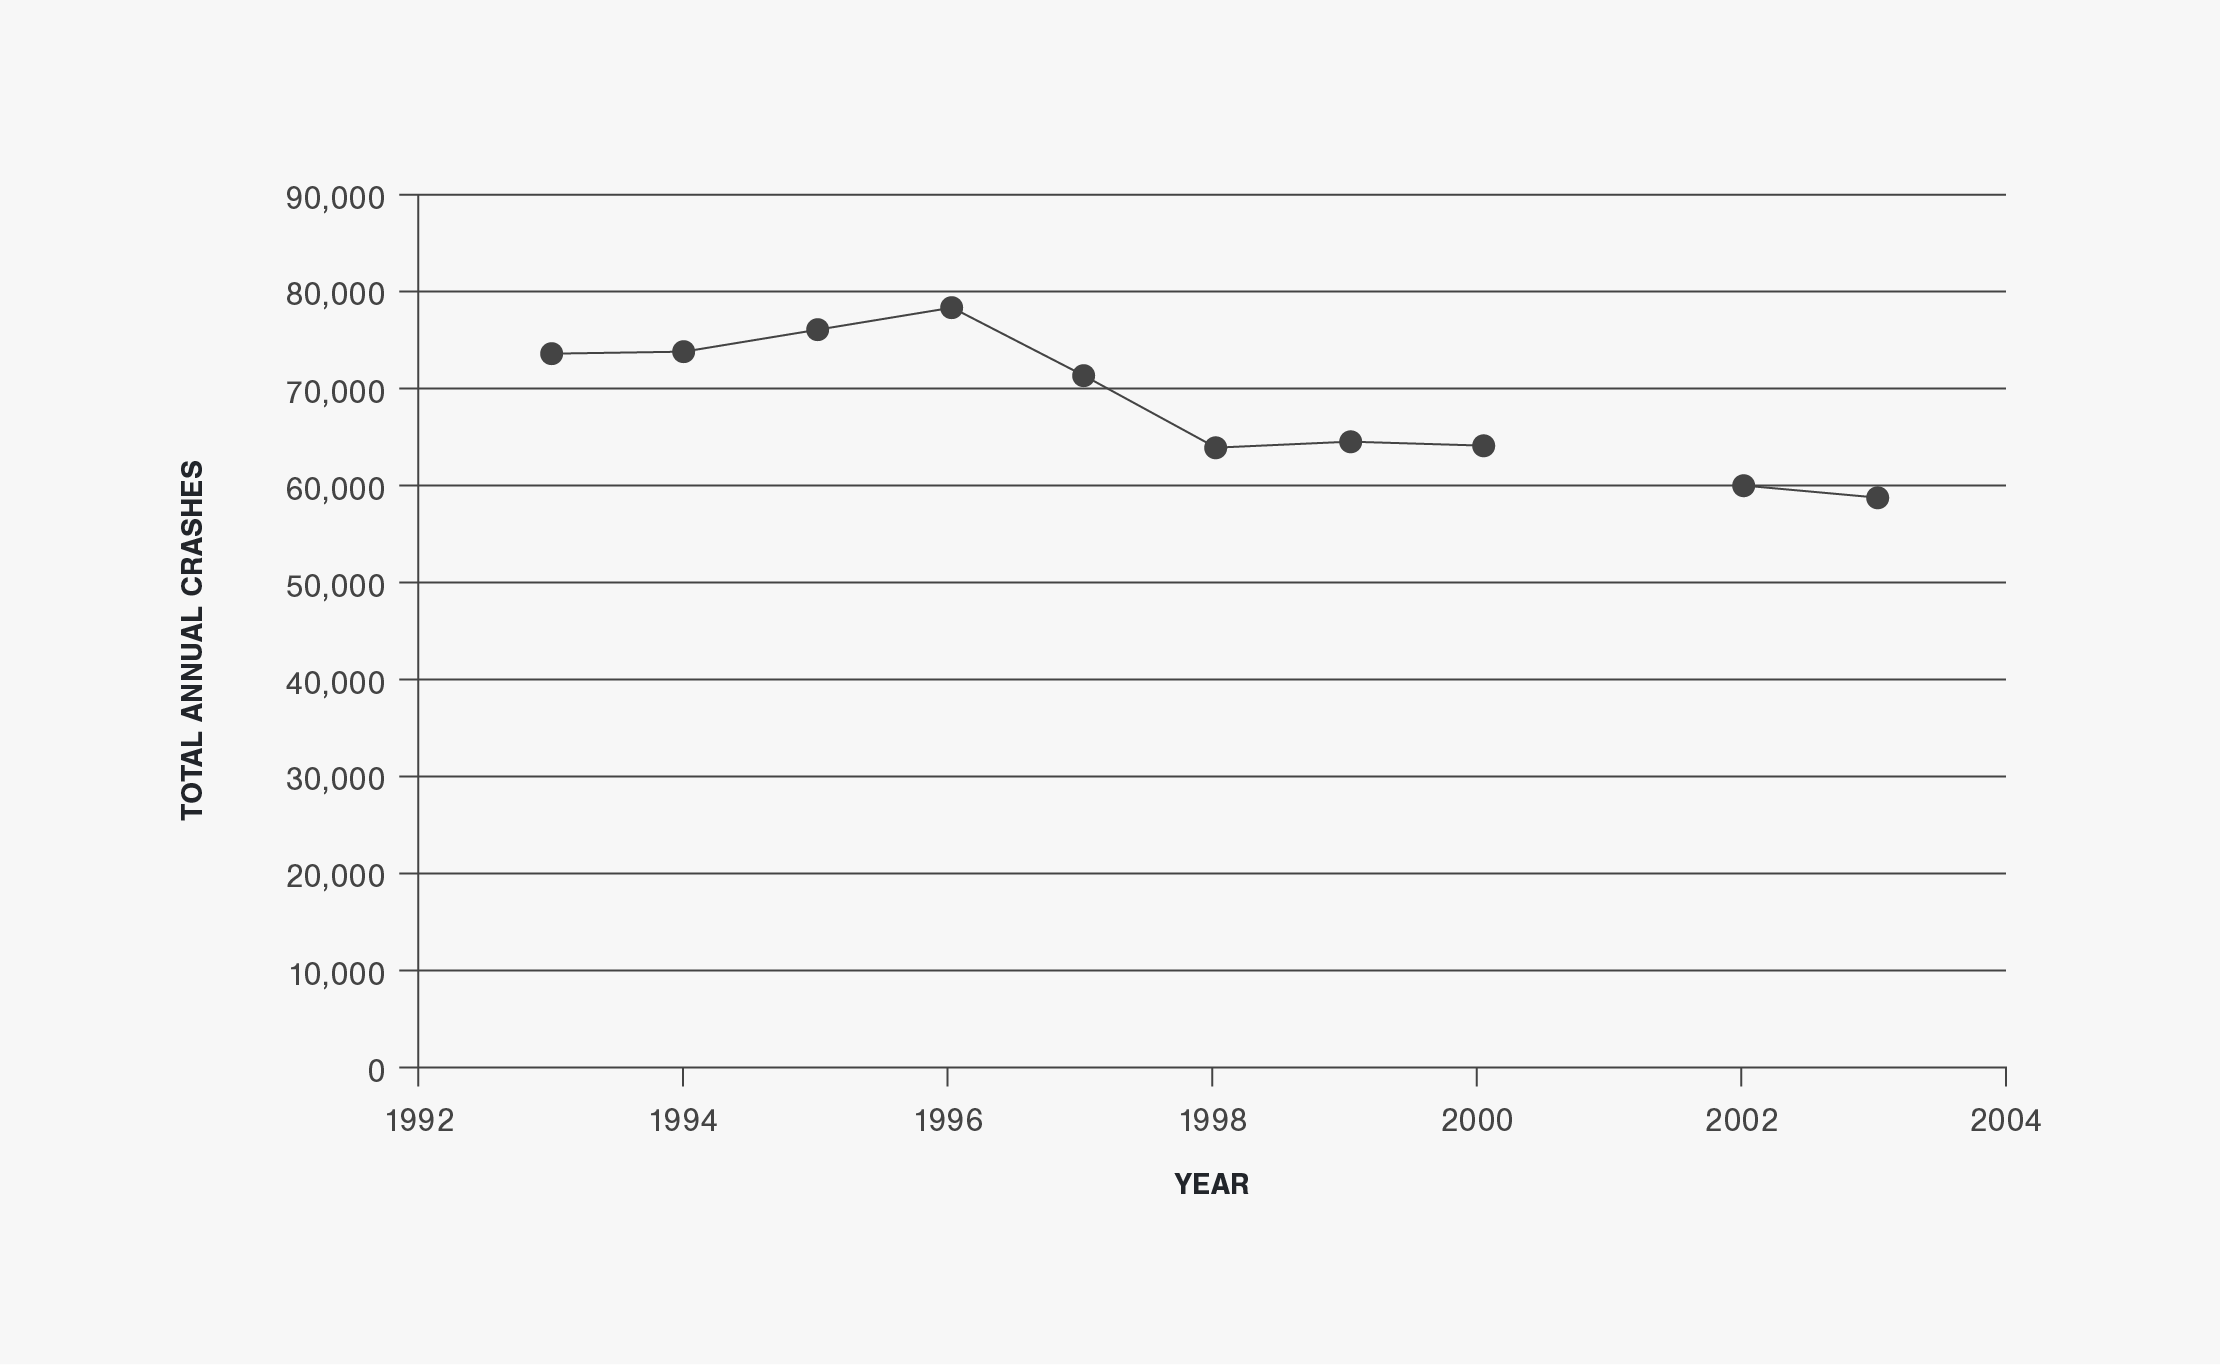
Figure 2 | Annual Vehicle-Miles-Traveled in Iowa (1993 to 2003)
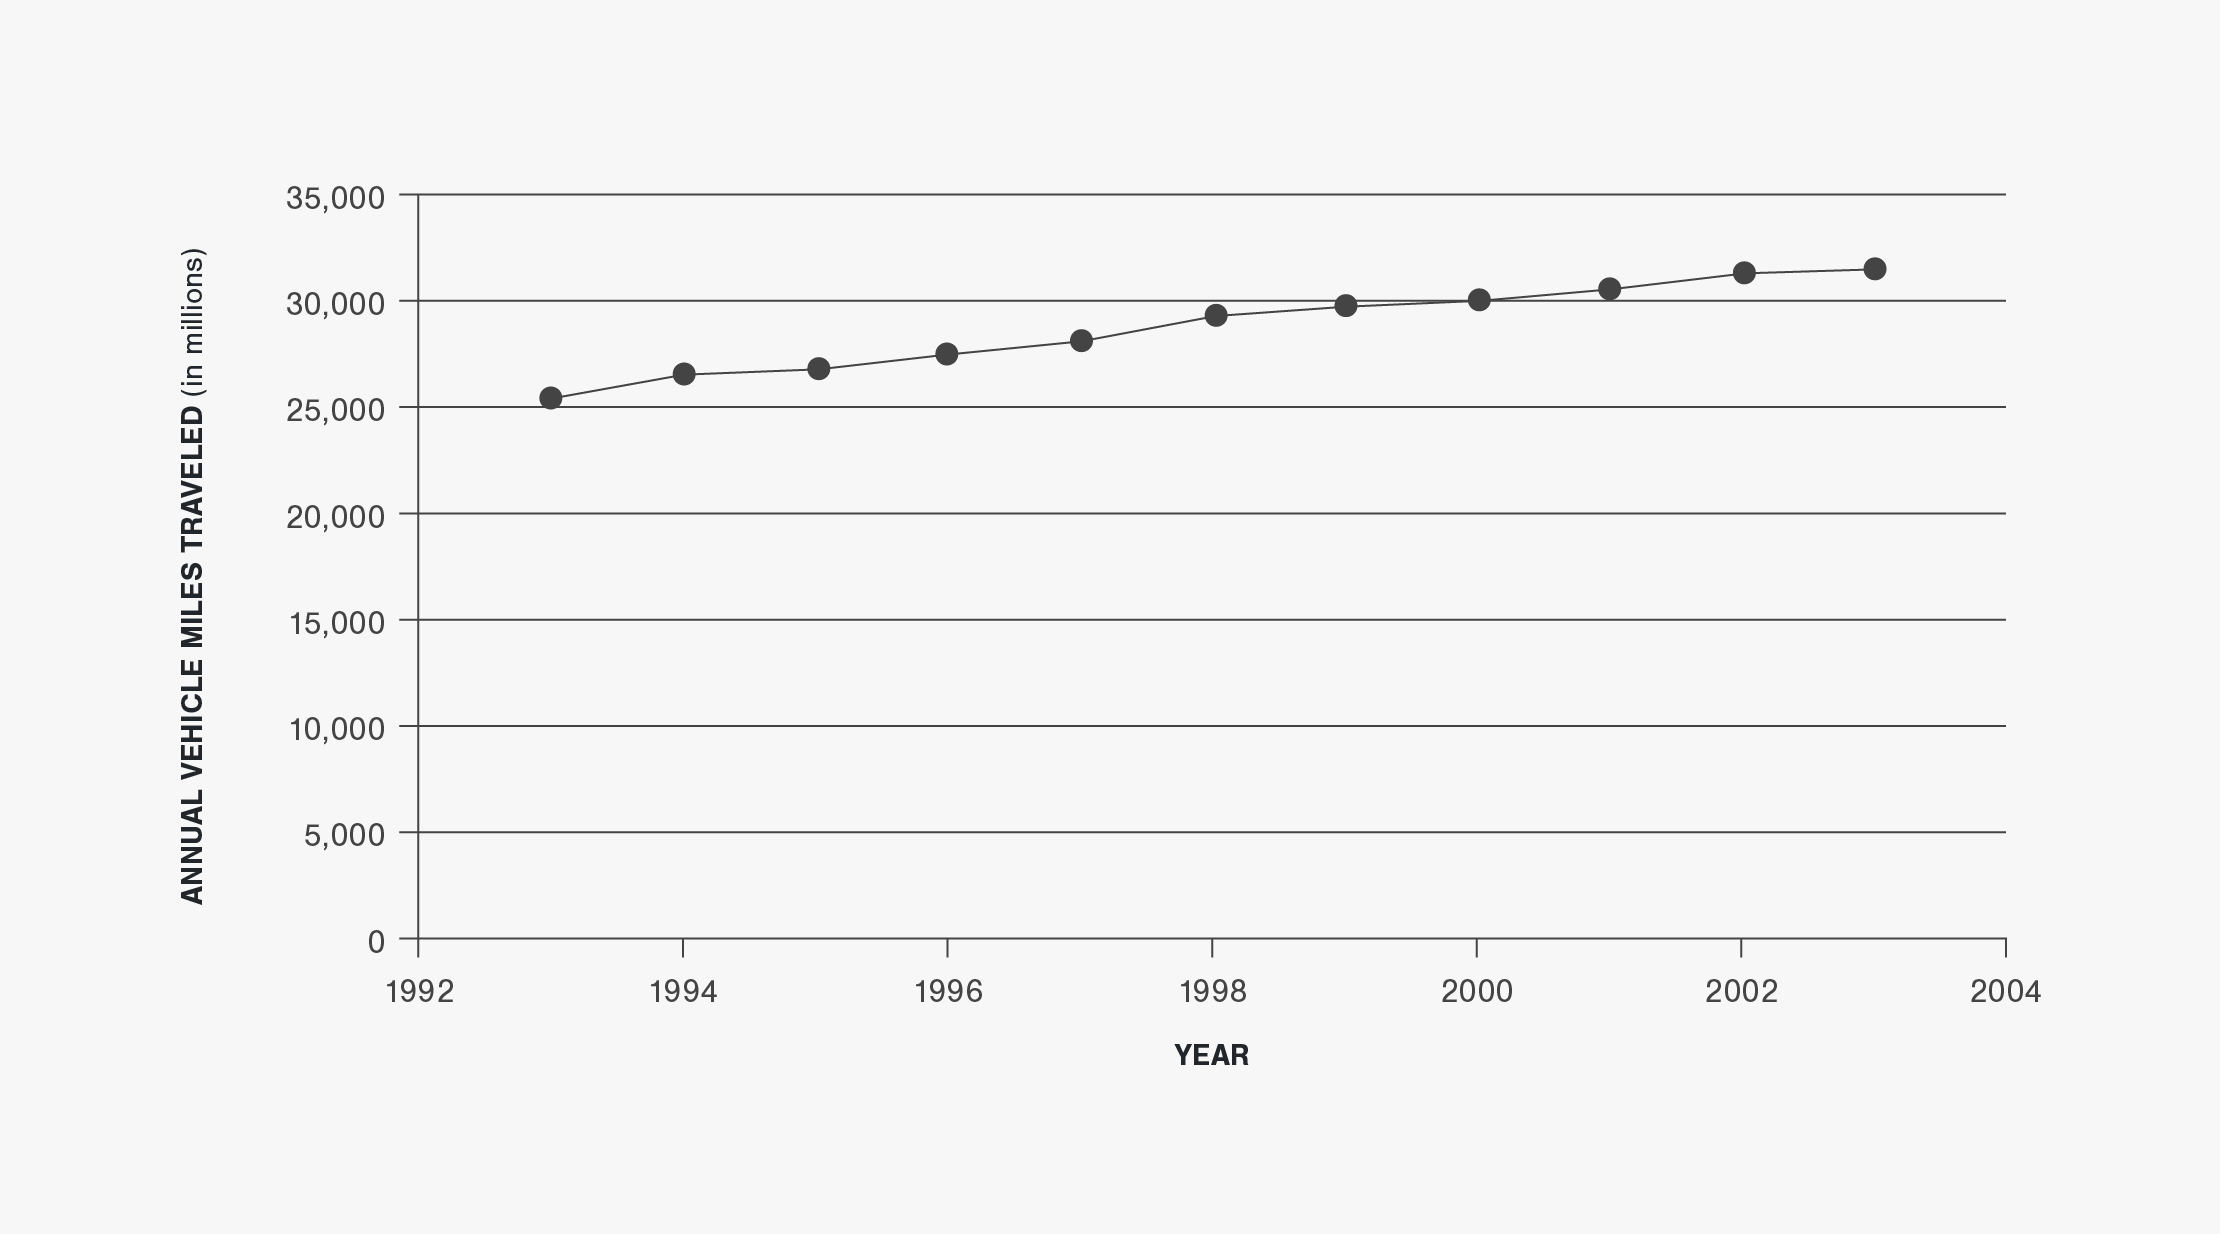
Figure 3 | Reported Animal-Vehicle Crashes in Iowa (1993 to 2003)
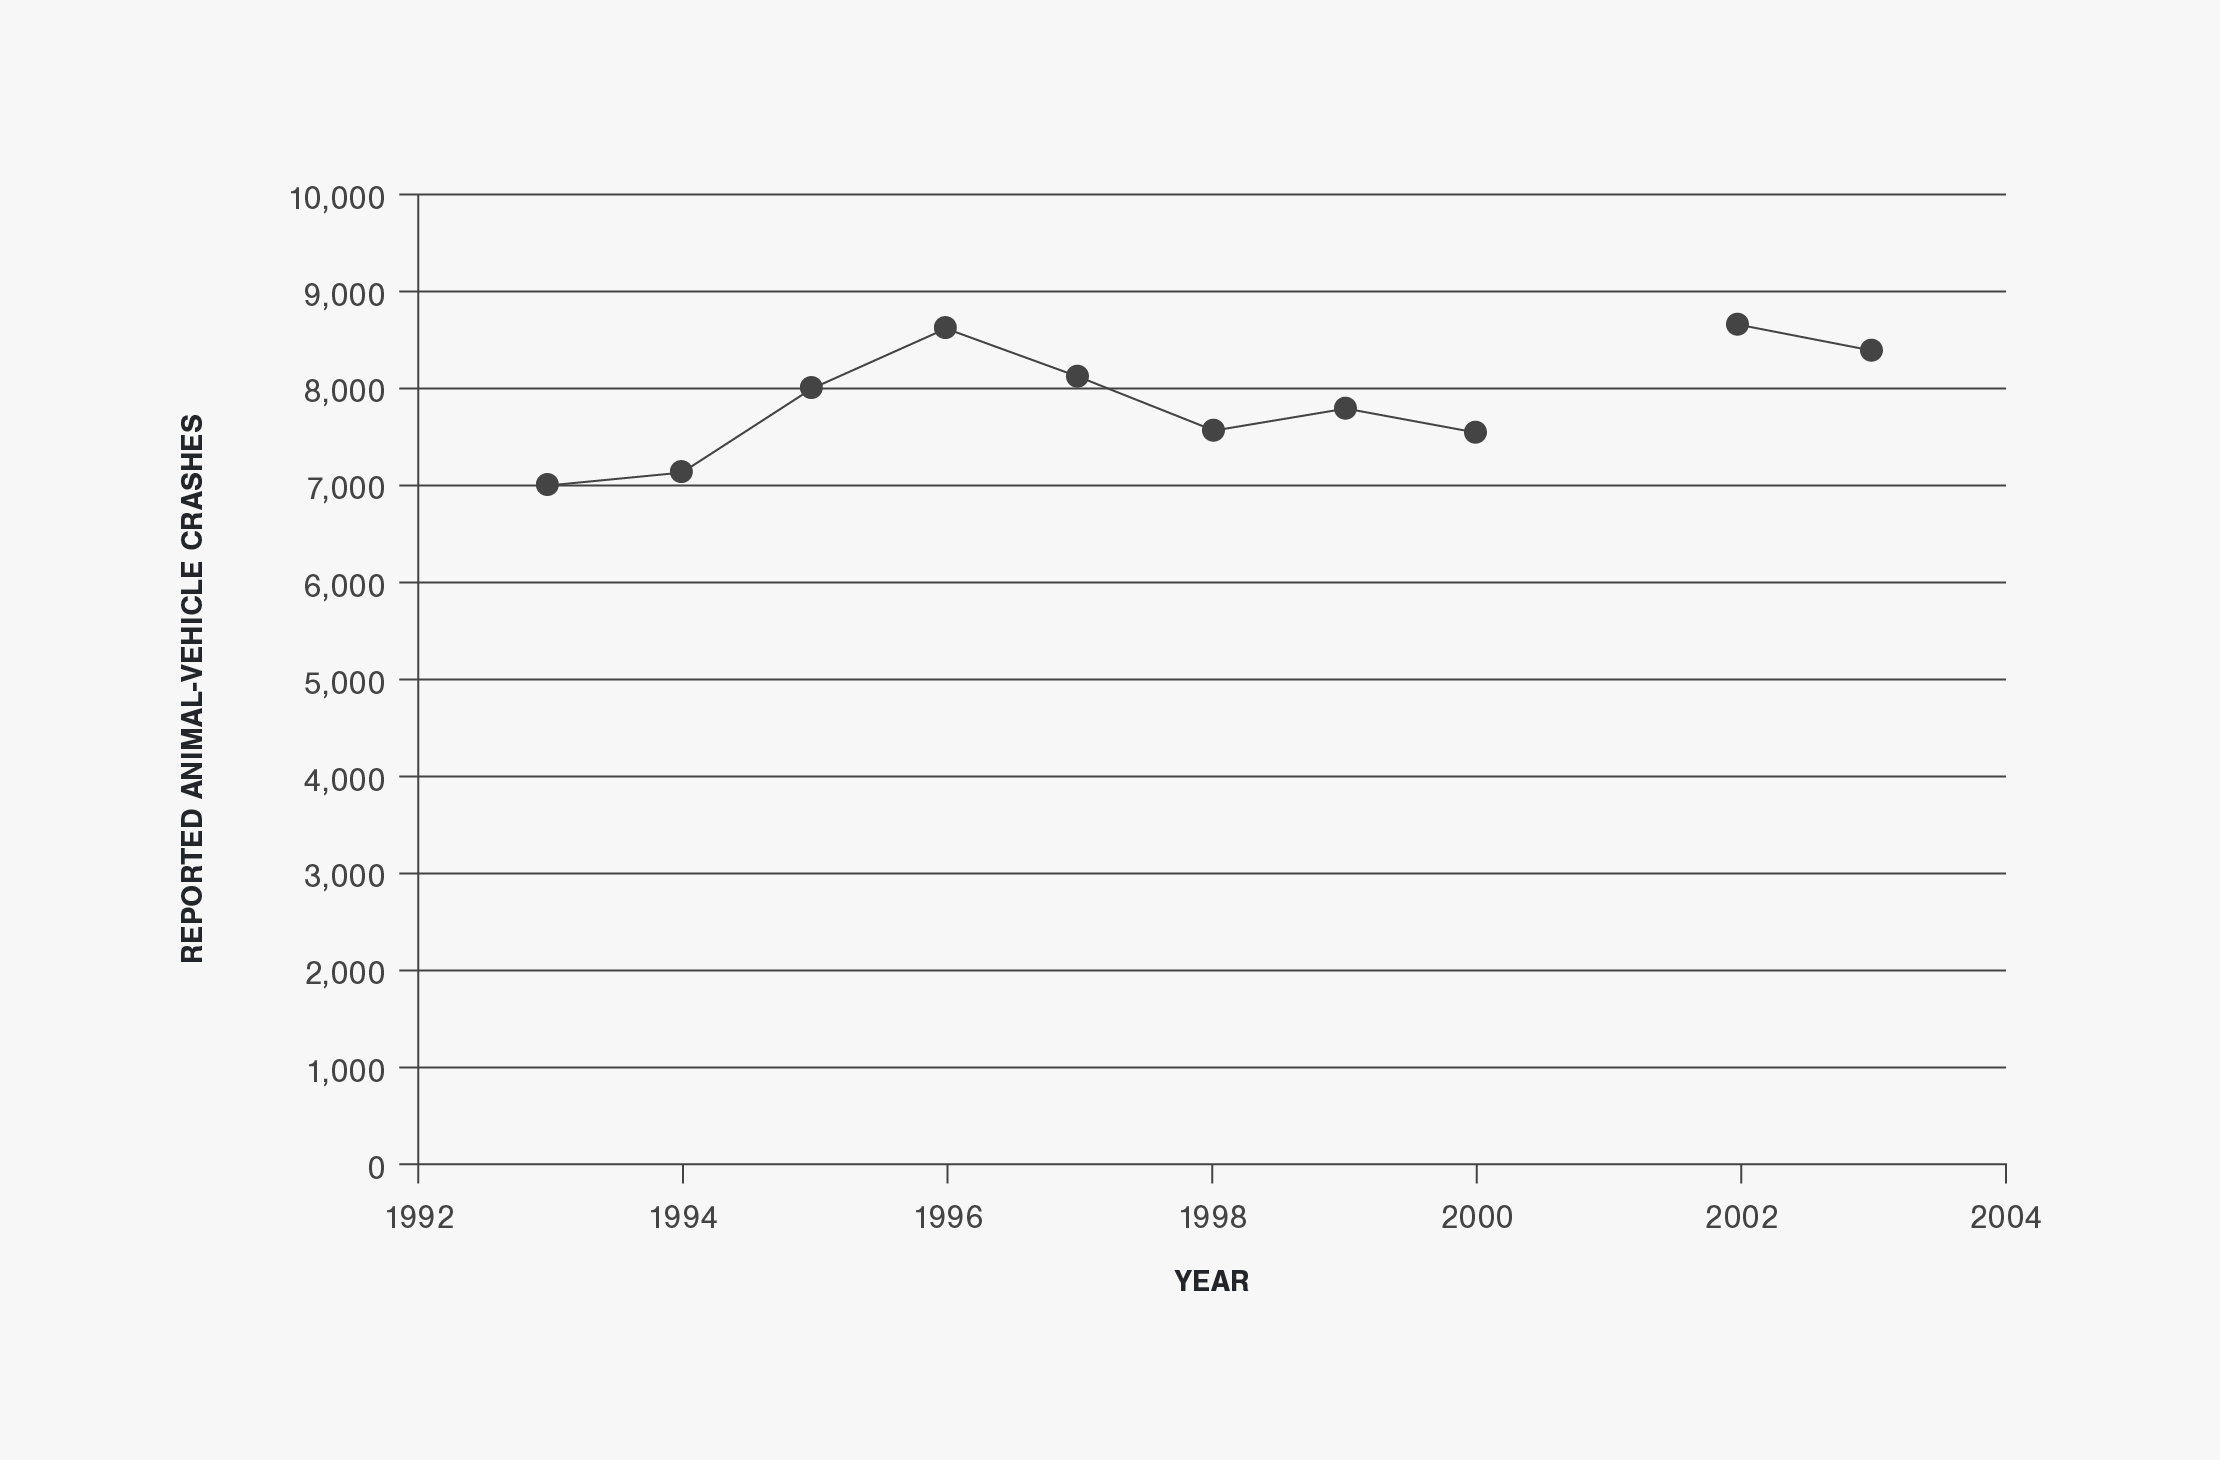
Figure 4 | Percent Animal-Vehicle Crashes in Iowa (1993 to 2003)
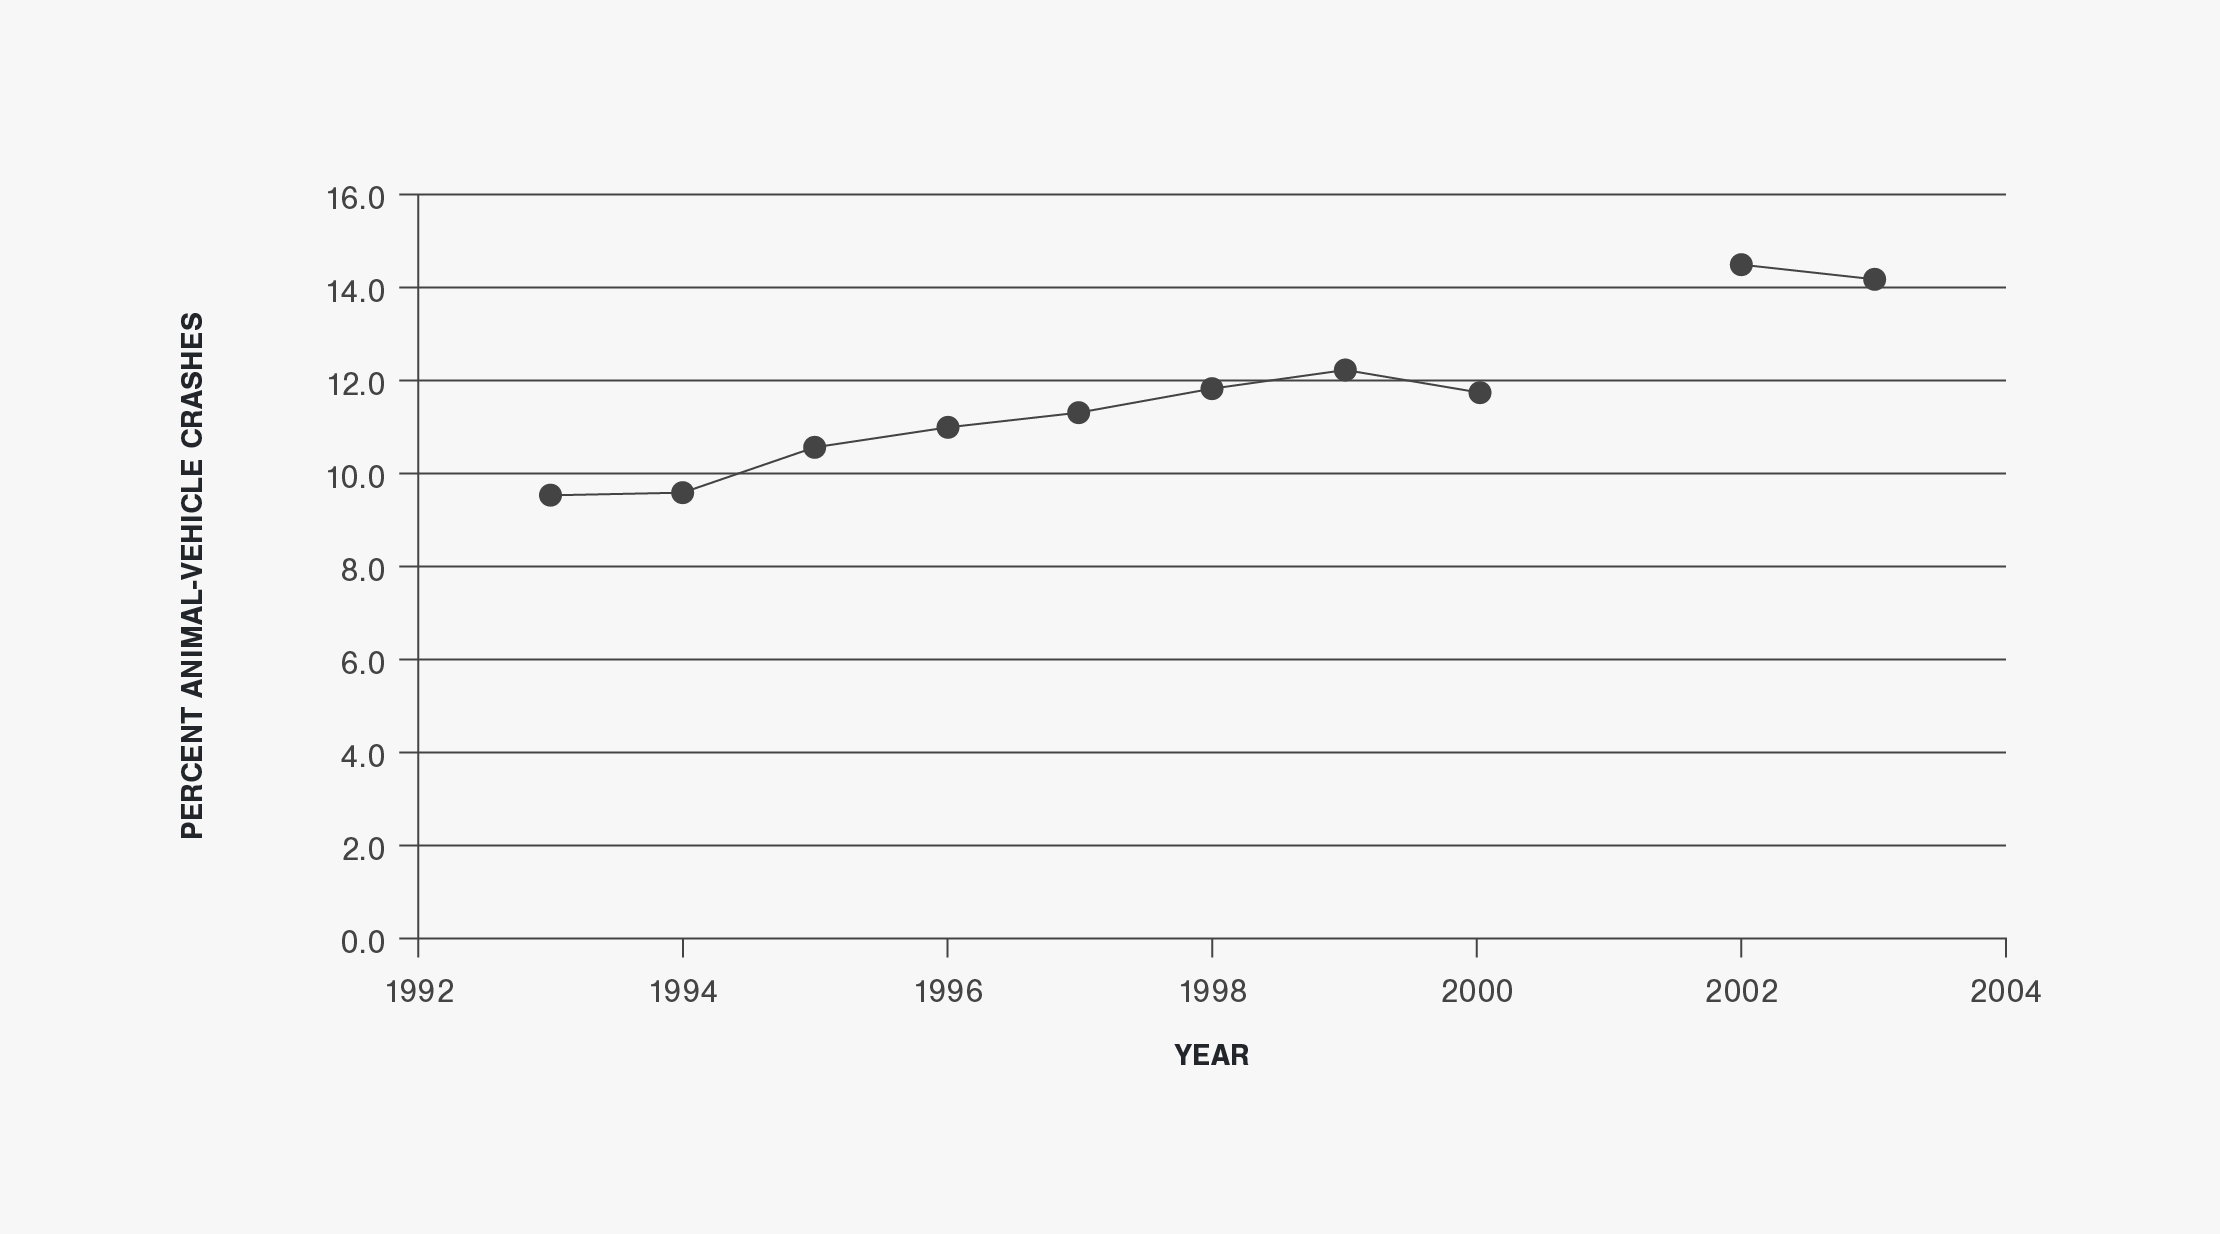
Figure 5 | Number of Animal-Vehicle Crash Fatalities and Injuries in Iowa (1993 to 2003)
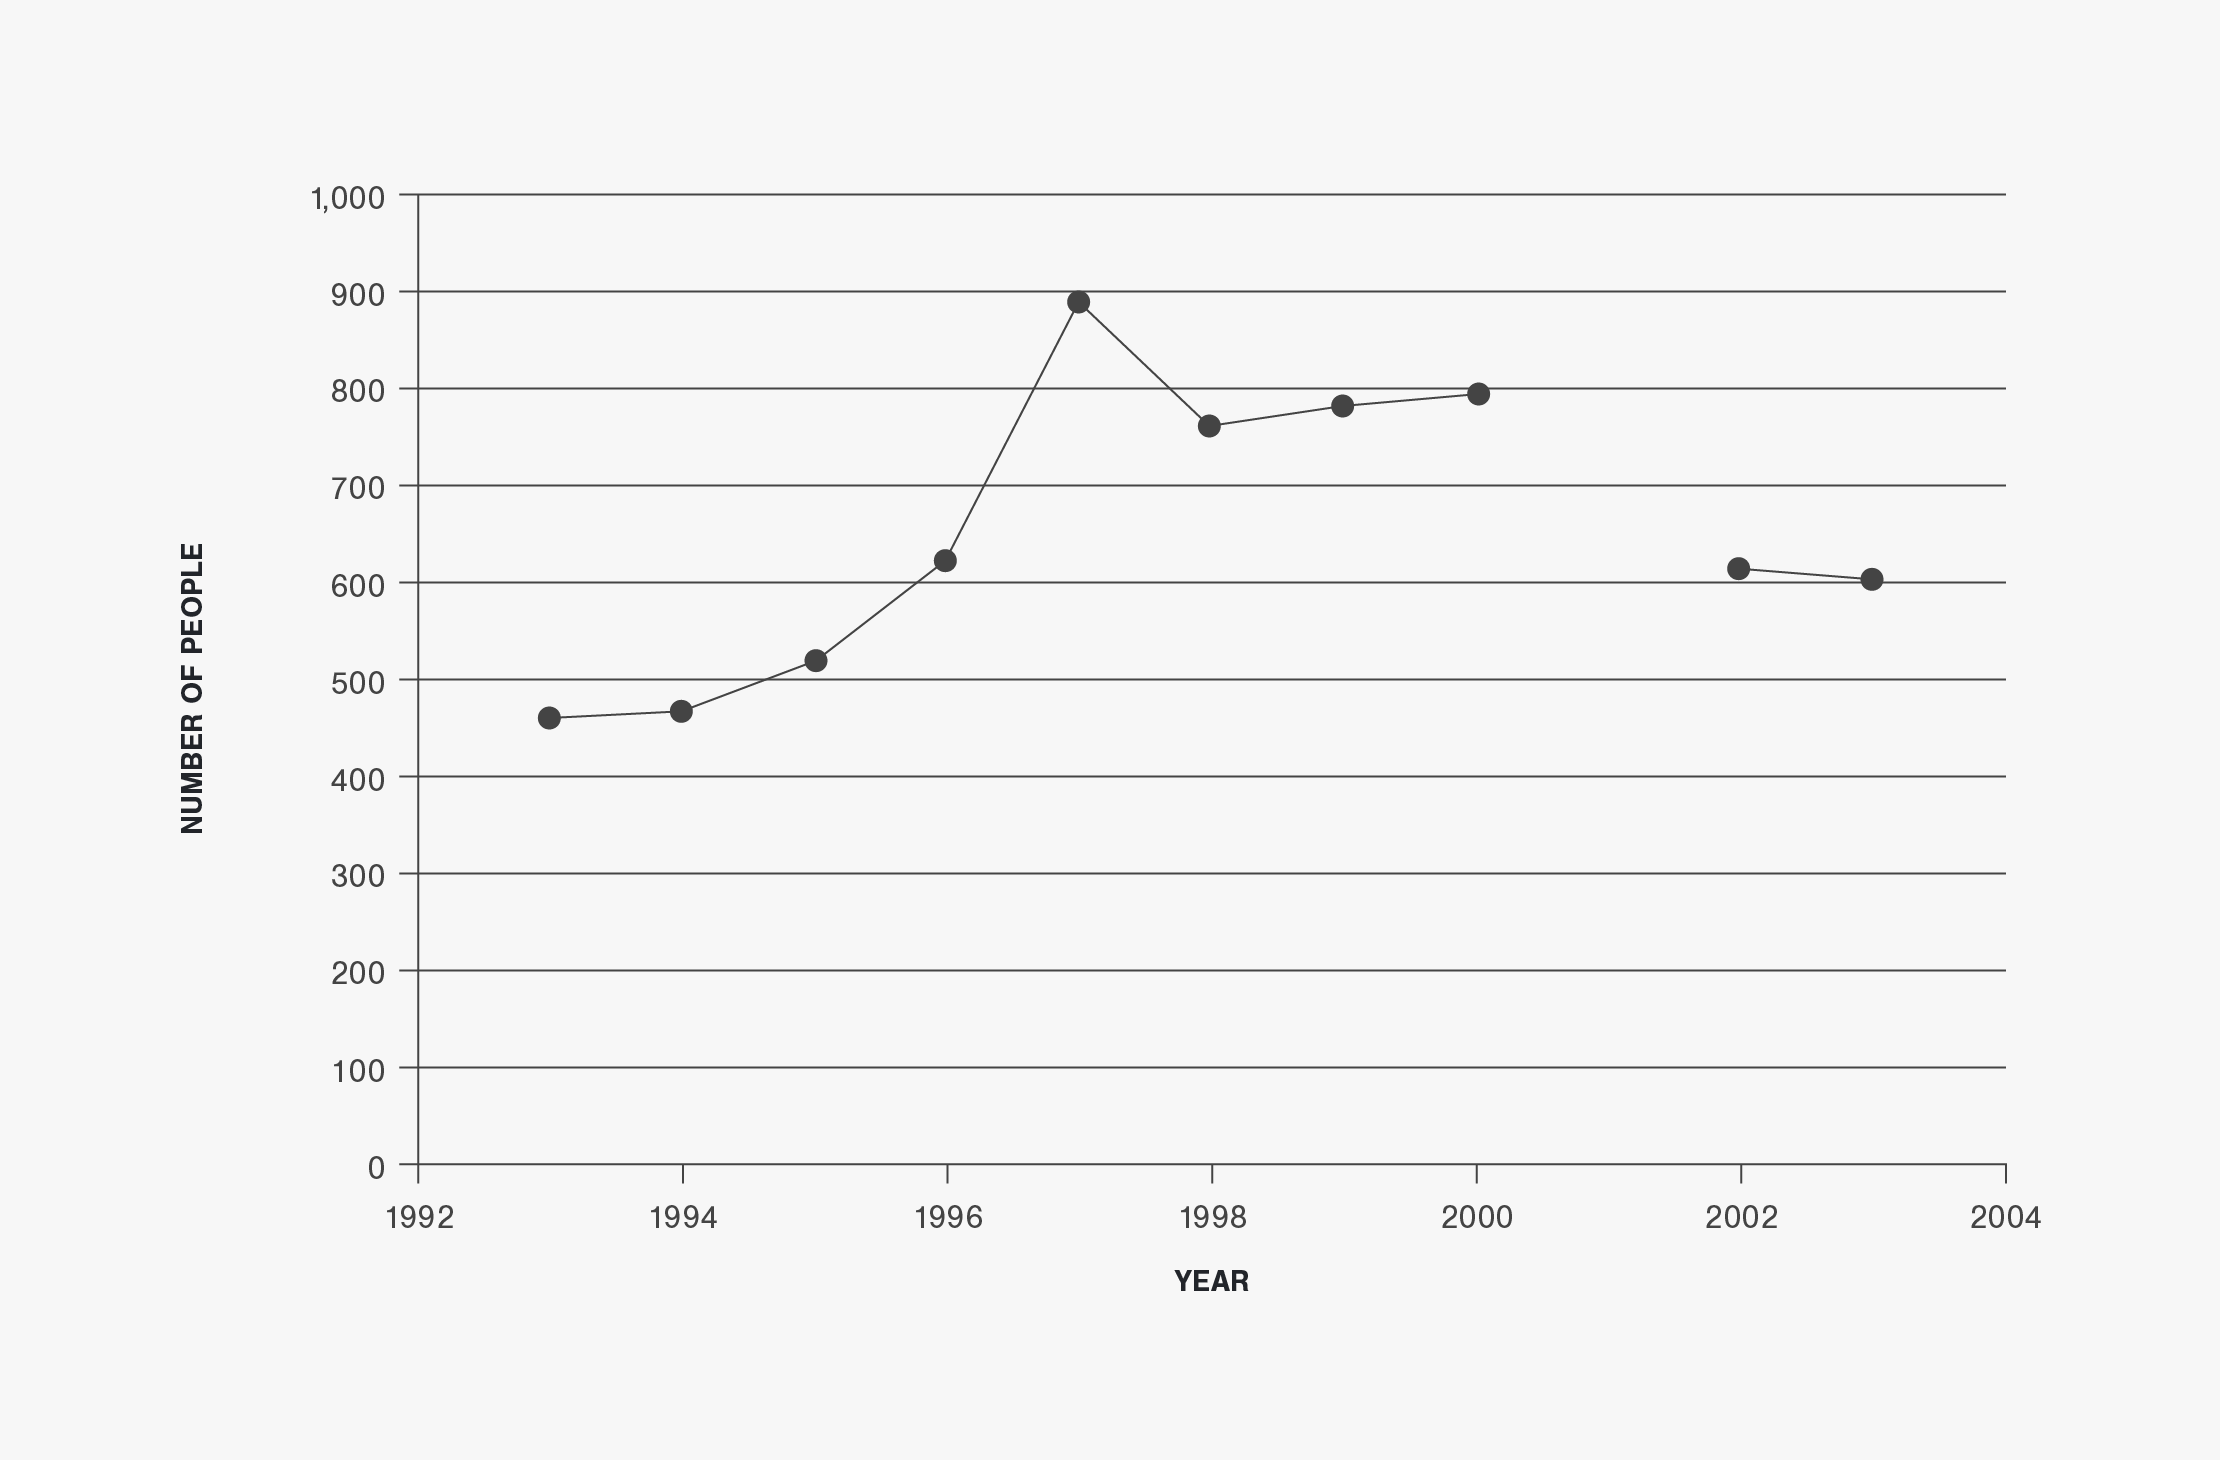
Figure 6 | Animal-Vehicle Crash Rate per 100 Million Vehicle-Miles-Traveled in Iowa (1993 to 2003)
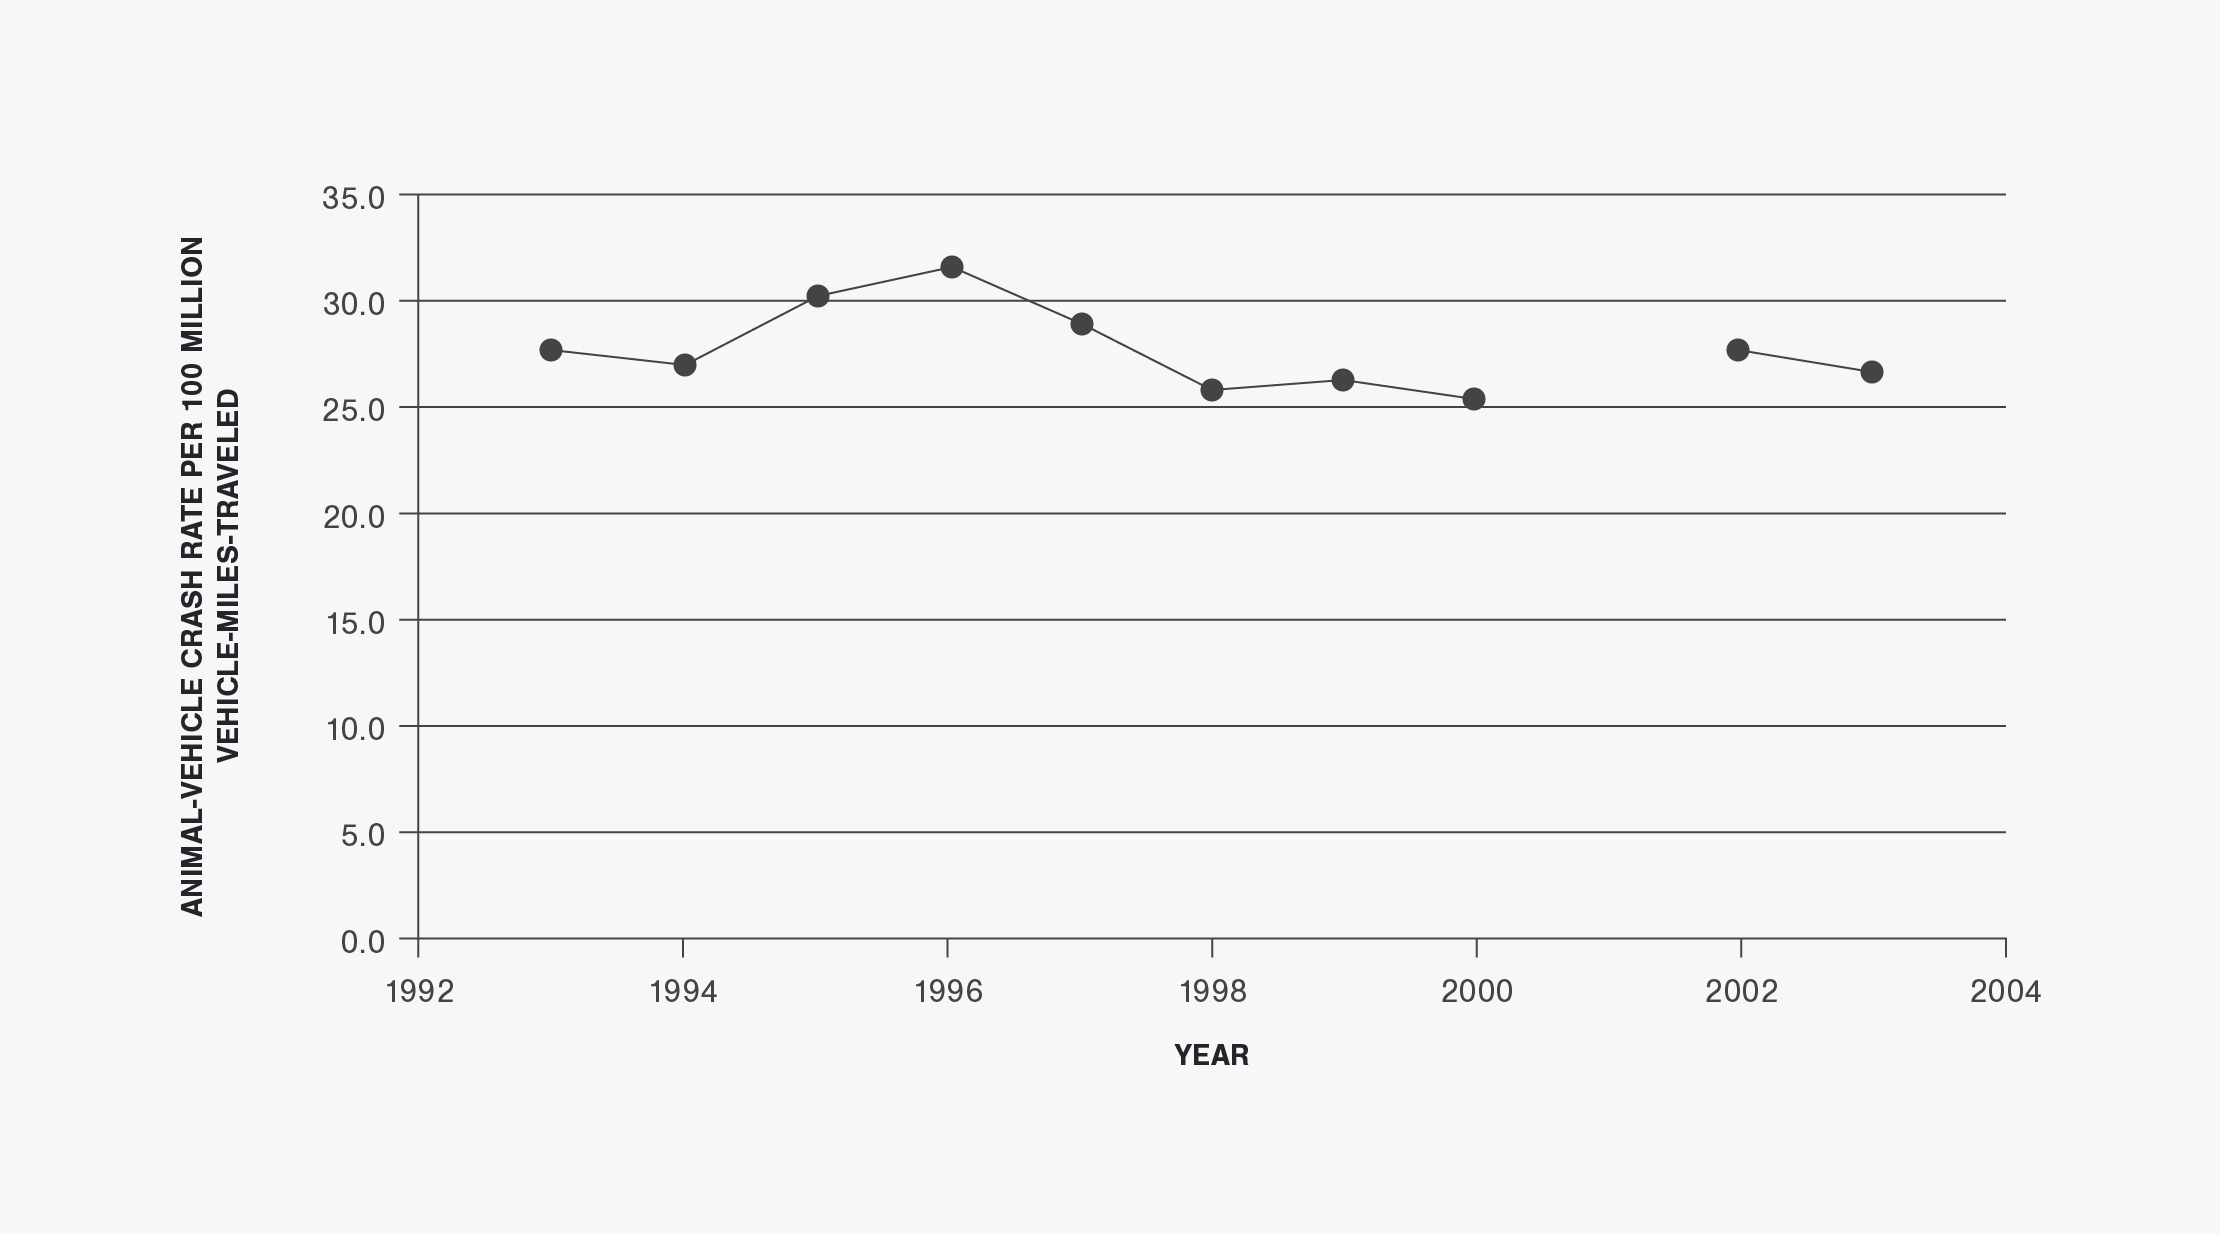
Figure 7 | Post-Hunt Deer Population Estimates and Animal-Vehicle Crashes in Iowa (1993 to 2003)
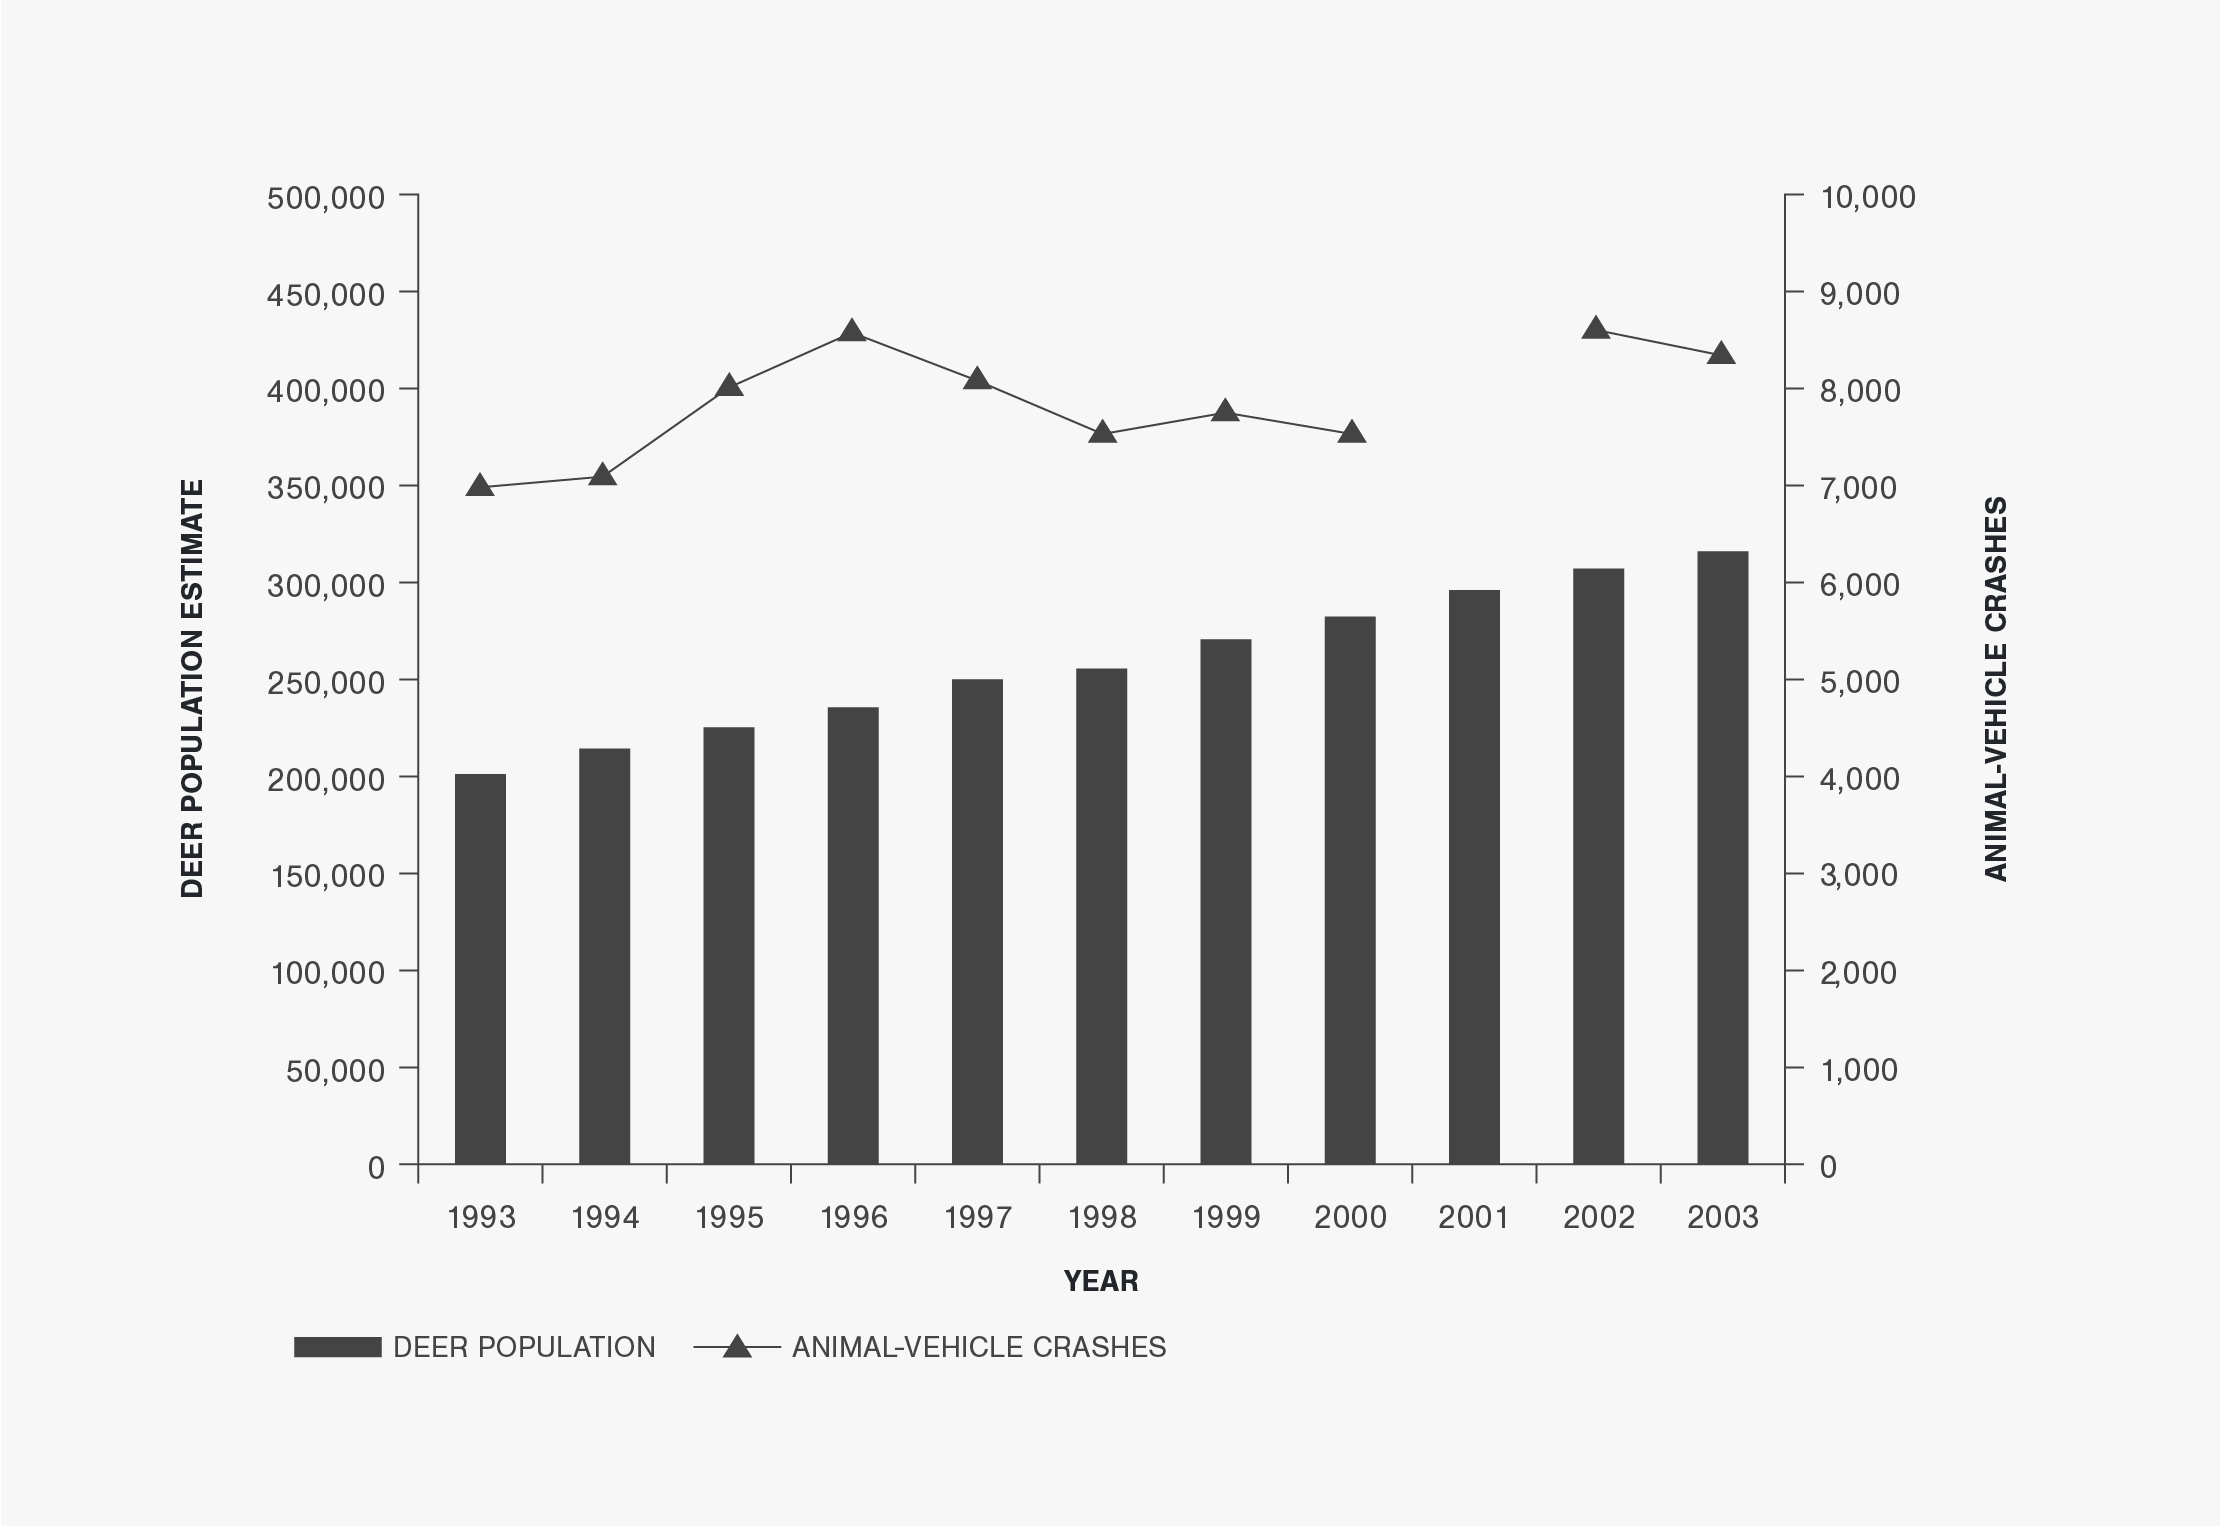
Figure 8 | Roadside Carcass Removals and Reported Animal-Vehicle Crashes in Iowa (1993 to 2003)
Iowa Data Table
Table A-2 | Iowa Animal-Vehicle Crash and Related Data (1993 to 2003)
a Minimum property damage reporting threshold changed from $500 to $1,000 in mid-1997.
b 2001 crash data not used in report due to change in safety data management procedures during that year.
Michigan Data
10-Year Report: This report used only a portion of the data available from Michigan. To view all Michigan data, including the most recent data available, please visit the Animal-Vehicle Crash Data page.
Michigan Data Summary
From 1993 to 2003 the average percentage of all crashes reported in Michigan that were DVCs was approximately 15.6 percent. This is the largest percentage of DVCs found in the five states considered in this report. An evaluation of the Michigan DVC-related data showed the following general patterns:
- The annual total number of crashes reported and summarized in Michigan has been relatively stable between 1993 and 2003 (See Figure 1). This safety measure has fluctuated between 350,000 and 450,000 for this time period. The largest annual number of reported crashes was in 1996 at 435,477, and the smallest number occurred in 1993 at 363,636. The AVMT in Michigan was stable from 1993 to 1995 and 2002 to 2003, but increased steadily between these two time periods (See Figure 2).
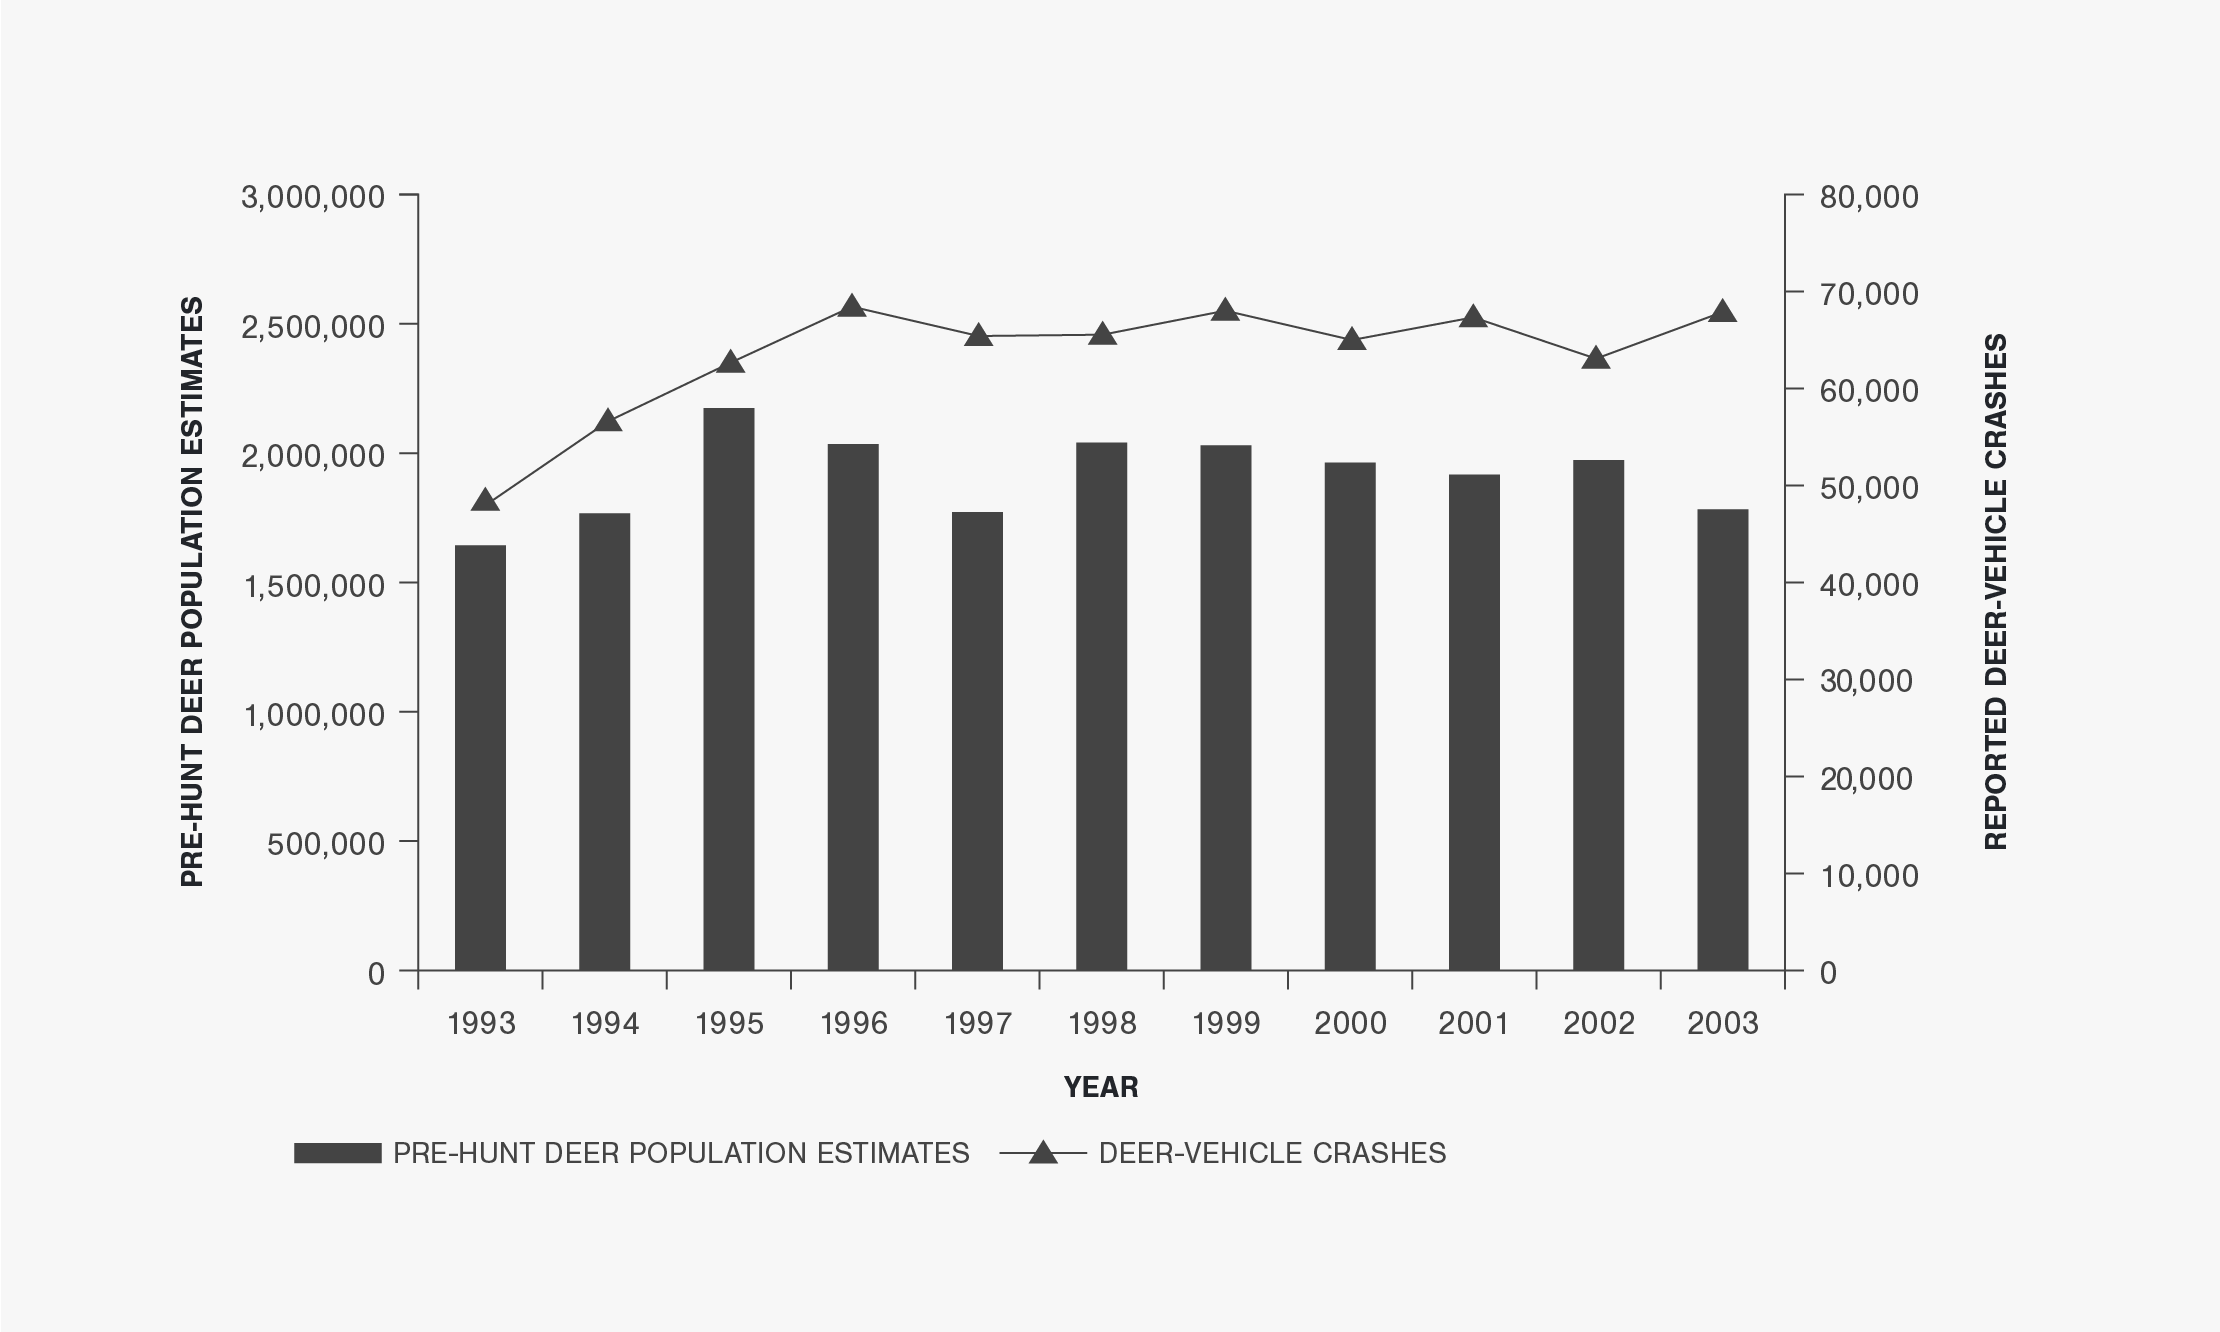
- The annual number of DVCs reported in Michigan increased from 47,812 in 1993 to 68,233 in 1996, but this measure has only ranged from 63,136 to 68,233 between 1996 and 2003 (See Figure 3). The percentage of total crashes represented by DVCs has increased from 13.2 percent in 1993 to 17.3 percent in 2003 (See Figure 4).
- The annual number of fatalities due to DVCs ranged from 2 to 11 between 1993 and 2003. There were a total of 67 DVC fatalities during these 11 years. The number of injuries and fatalities due to DVCs in Michigan increased from 1993 to 1998, but has seen a decrease from 1998 to 2003. However the largest annual number of reported DVC fatalities occurred in both 2001 and 2003.
- Similar to the number of DVCs reported, the DVC rate (i.e., the number of DVCs per HMVMT) increased from 1993 to 1996, but between 1996 and 2003 the annual number of reported DVCs has been relatively stable and the statewide DVC rate decreased slightly. The Michigan DVC rate peaked at 77.8 DVCs per HMVMT in 1996 and was at 69.0 DVCs per HMVMT in 2003.
- Michigan also provided annual deer population estimates from 1993 to 2003. Figure 7 shows that the annual pre-hunt deer population estimates increased from 1,630,000 in 1993 to 2,171,000 in 1995 (a 33.2 percent increase), and then generally decreased from that point to 1,776,000 deer in 2003 (an 18.2 percent decrease in eight years). The number of carcasses removed from the roadside in Michigan was not provided and does not appear to be summarized in the state.
Figures
Figure 1 | Total Crashes Reported in Michigan (1993 to 2003)
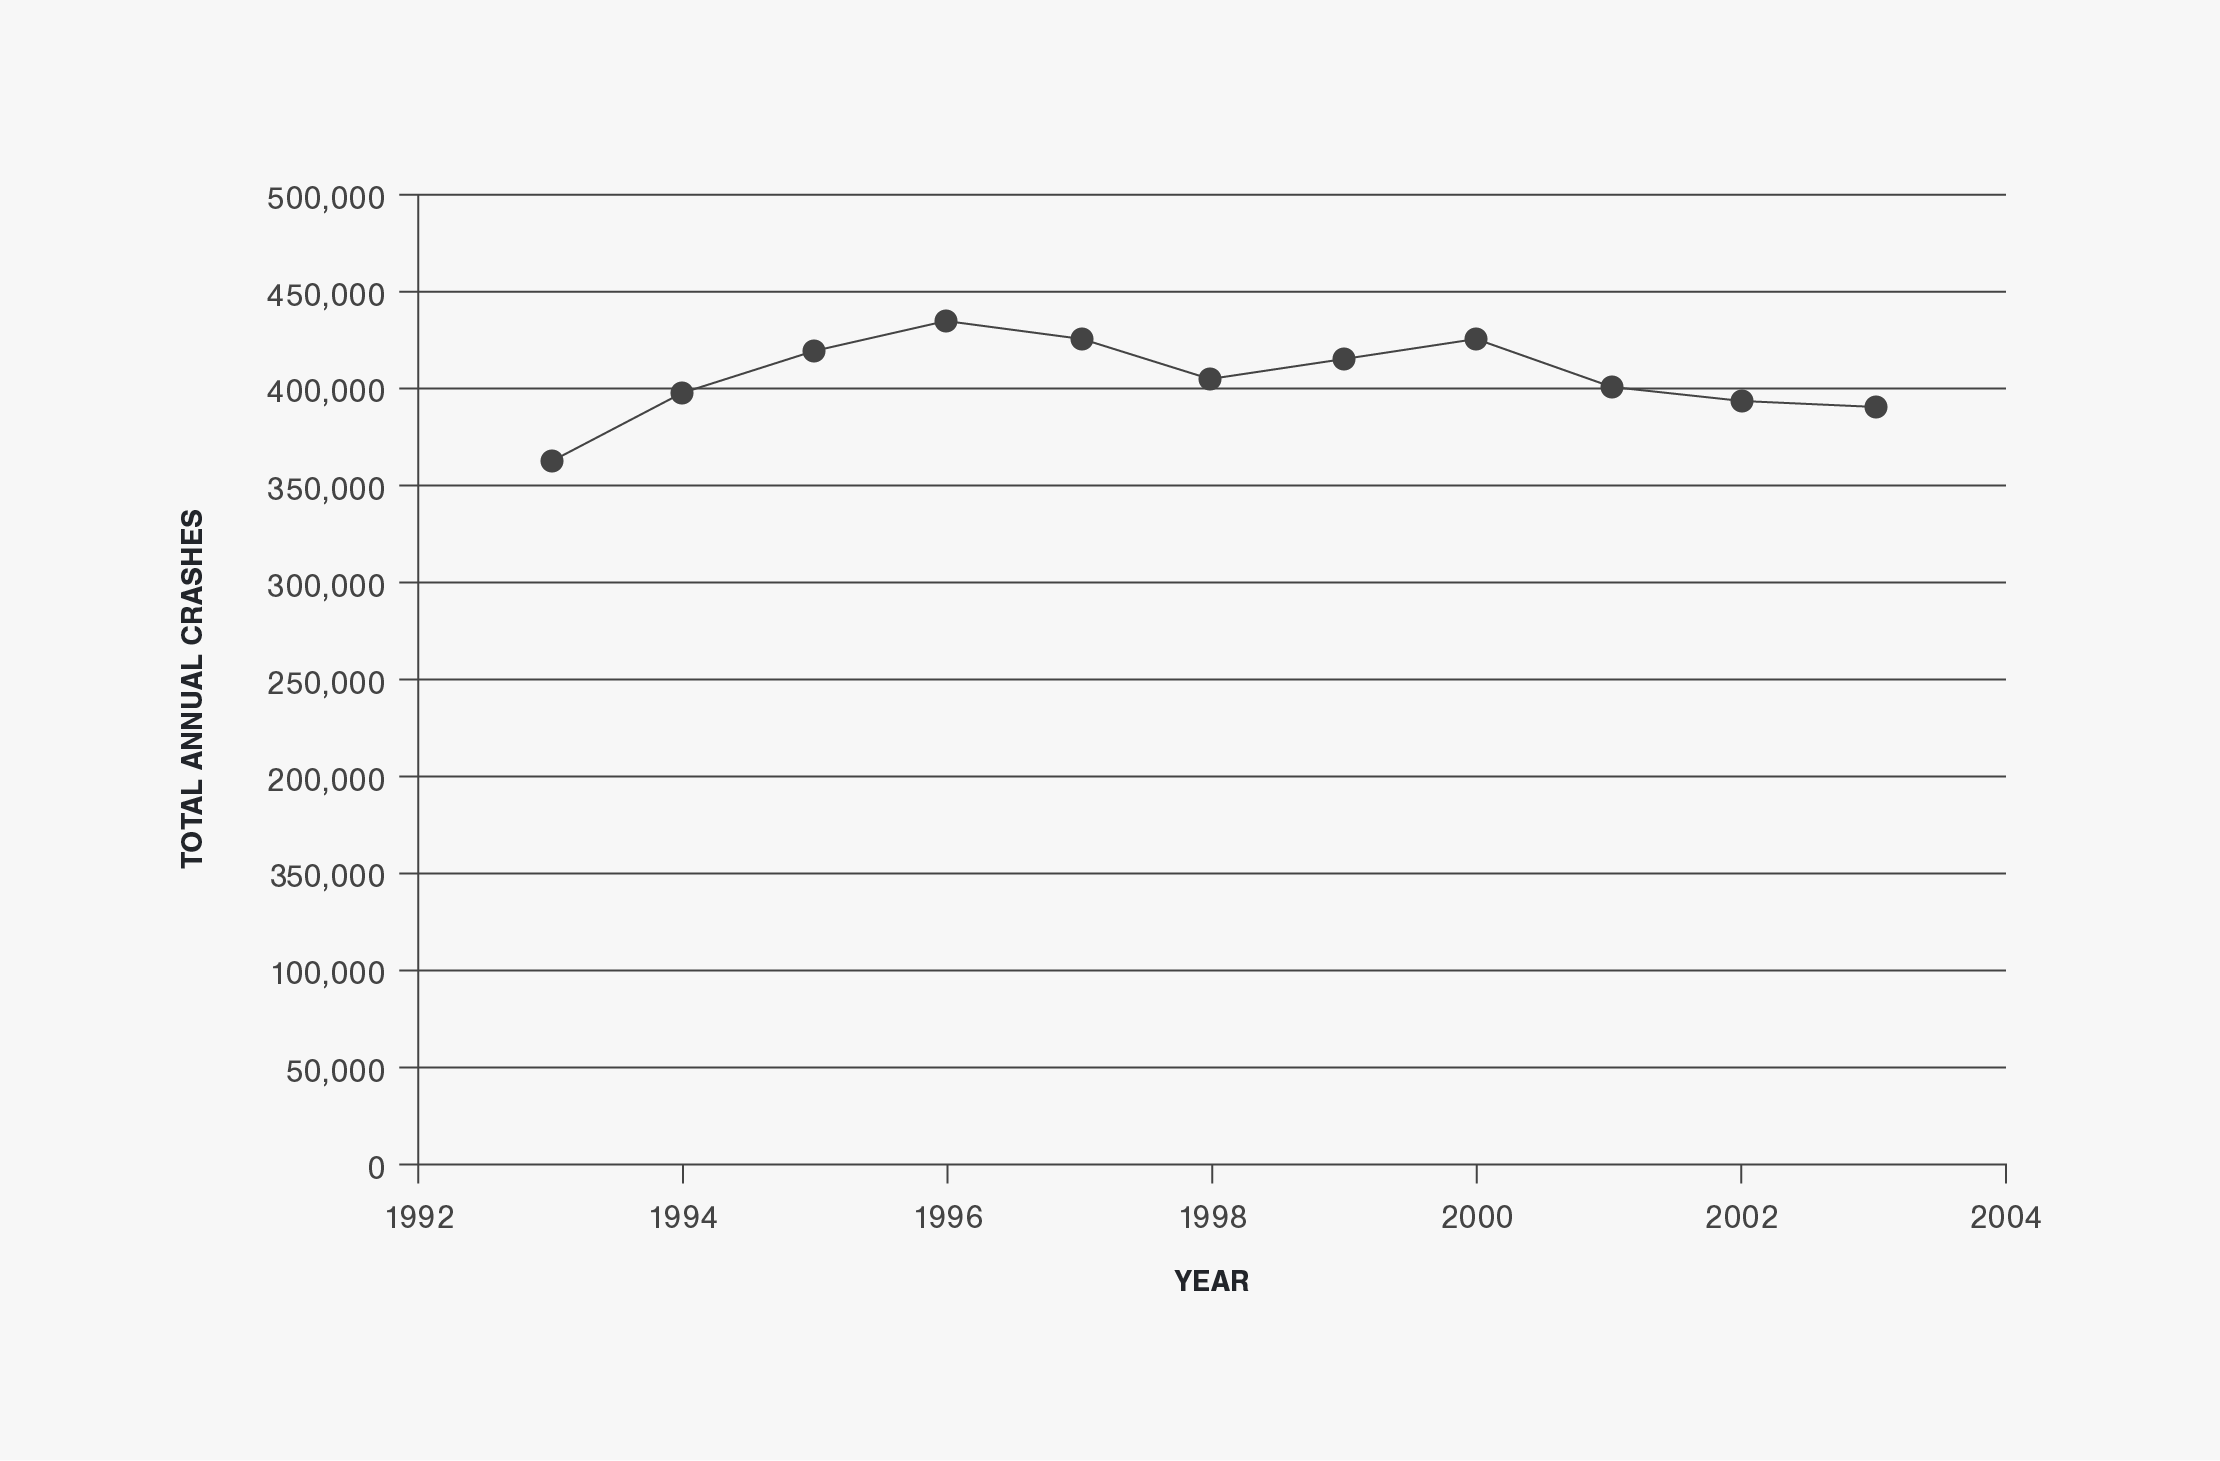
Figure 2 | Annual Vehicle-Miles-Traveled in Michigan (1993 to 2003)
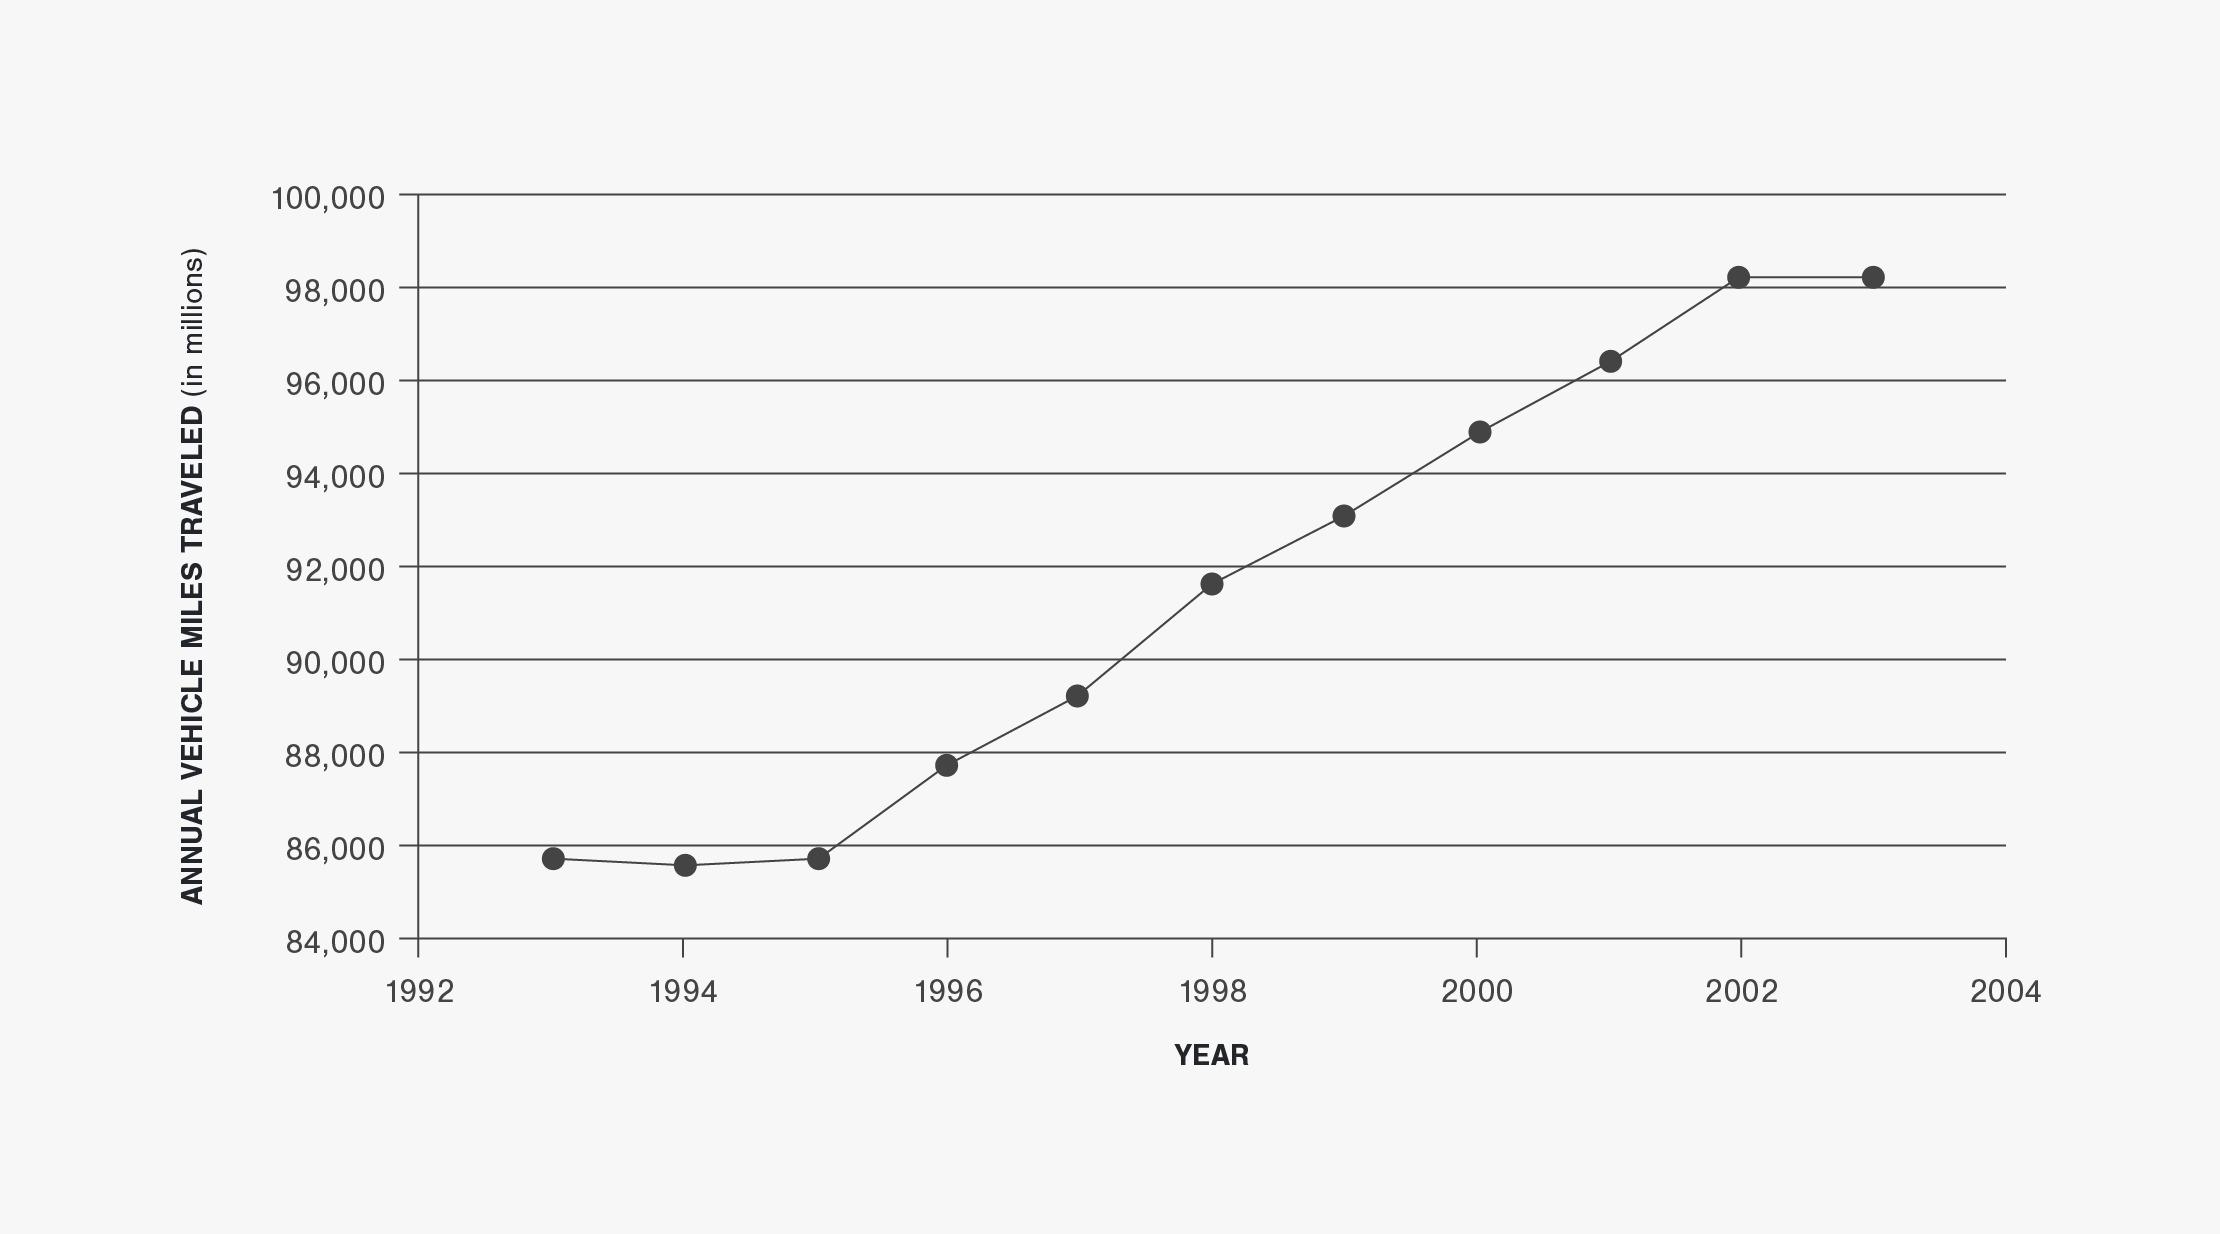
Figure 3 | Reported Deer-Vehicle Crashes in Michigan (1993 to 2003)
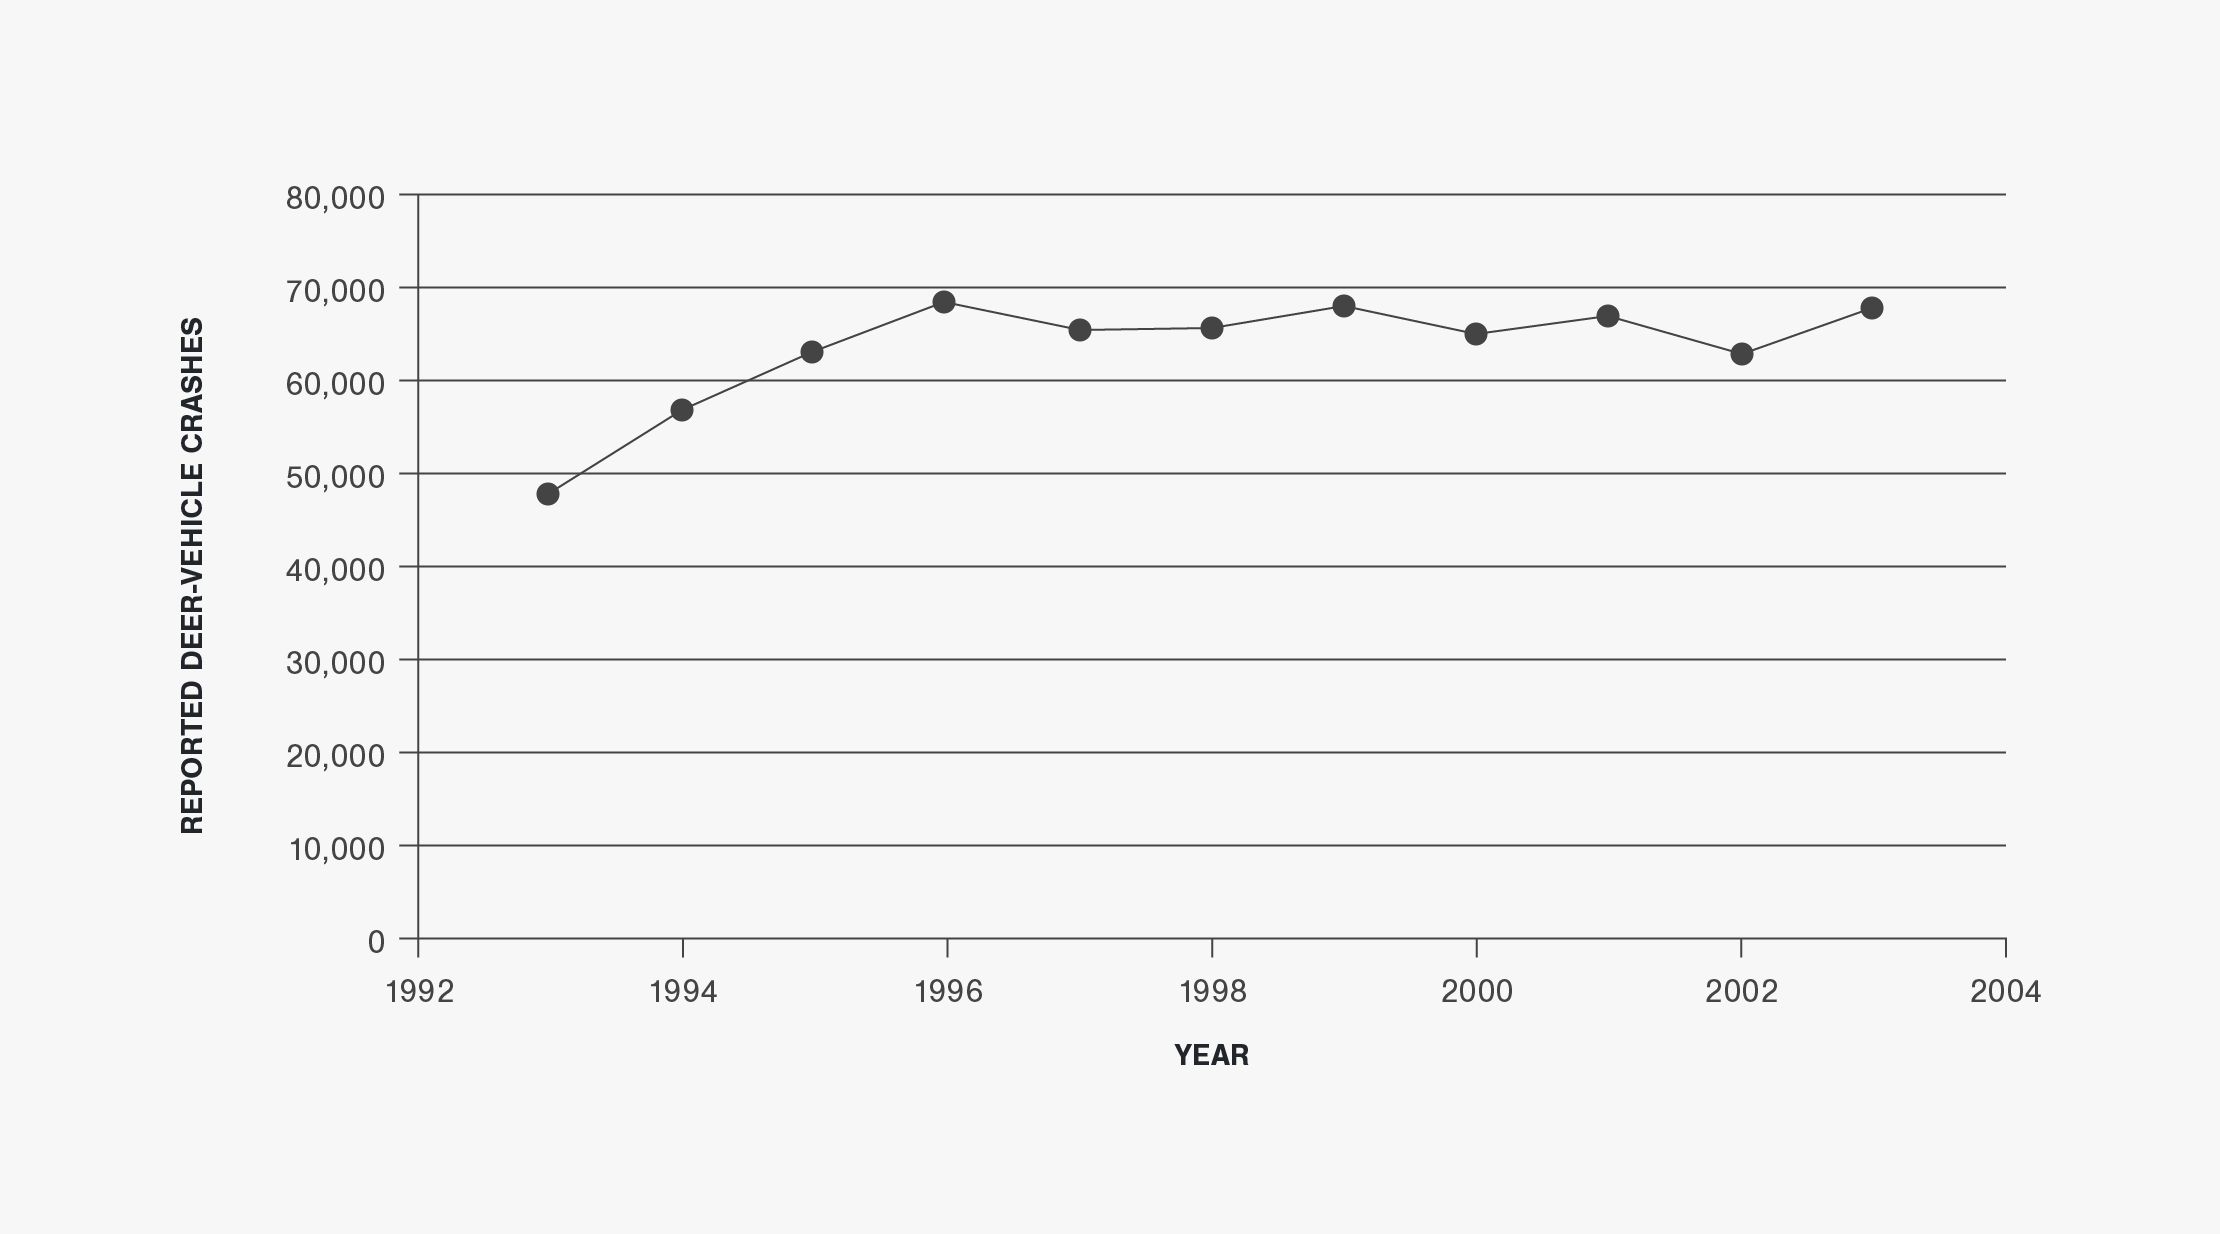
Figure 4 | Percent Deer-Vehicle Crashes in Michigan (1993 to 2003)
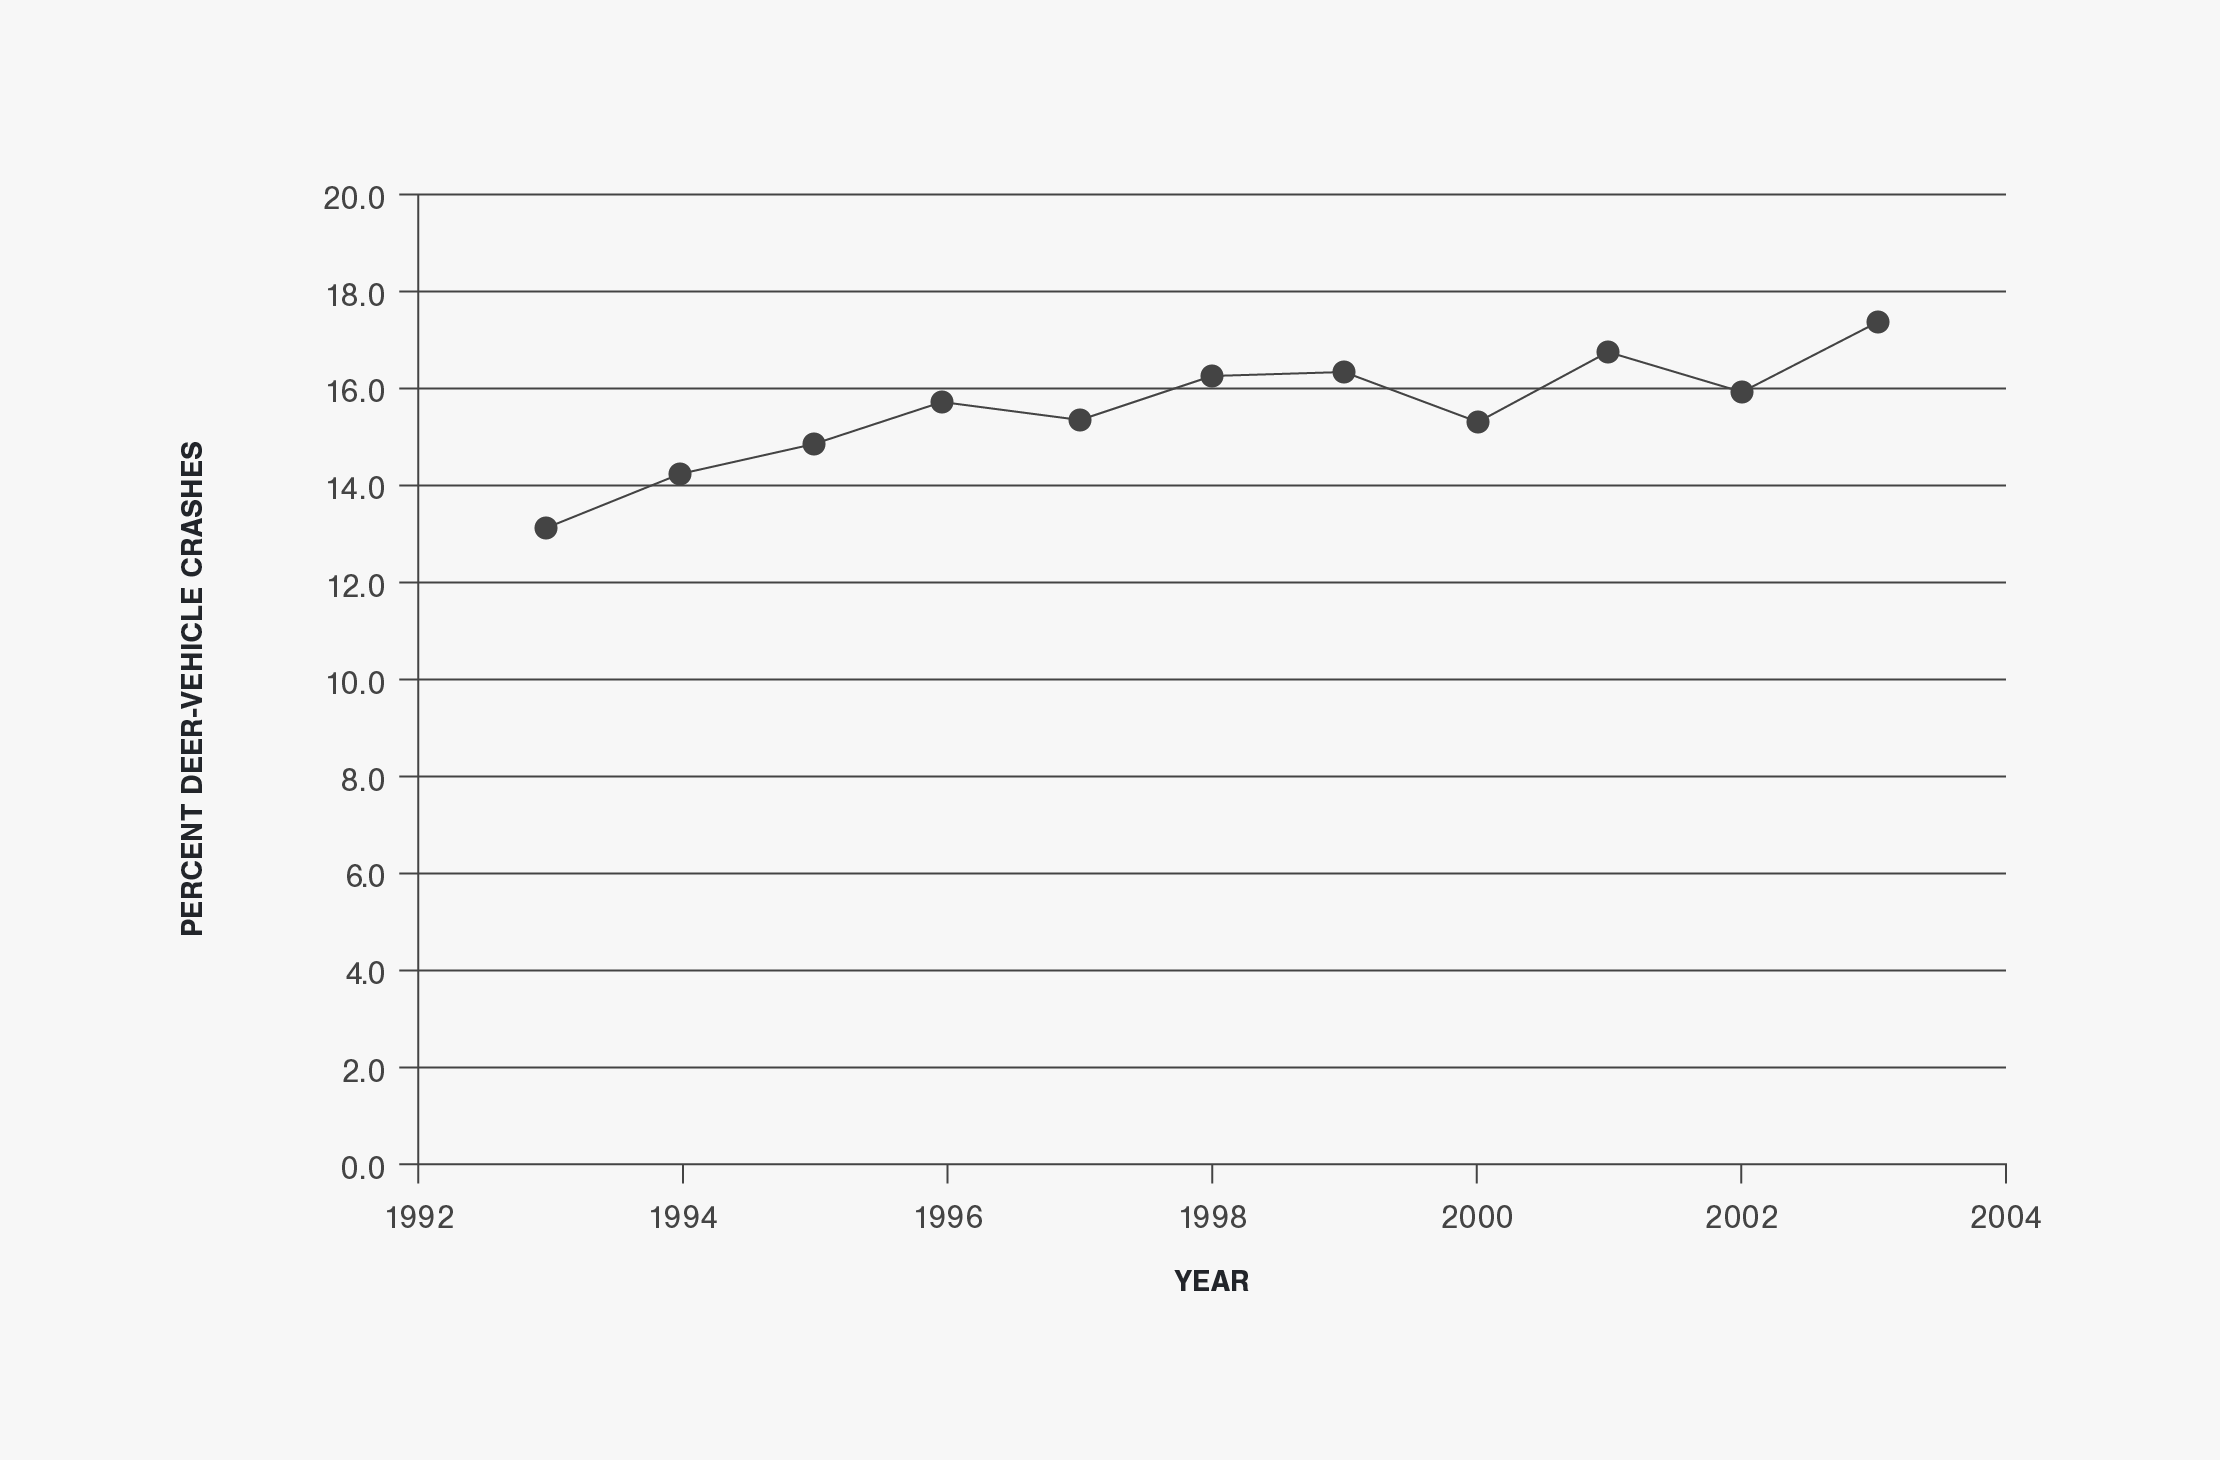
Figure 5 | Number of Deer-Vehicle Crash Fatalities and Injuries in Michigan (1993 to 2003)
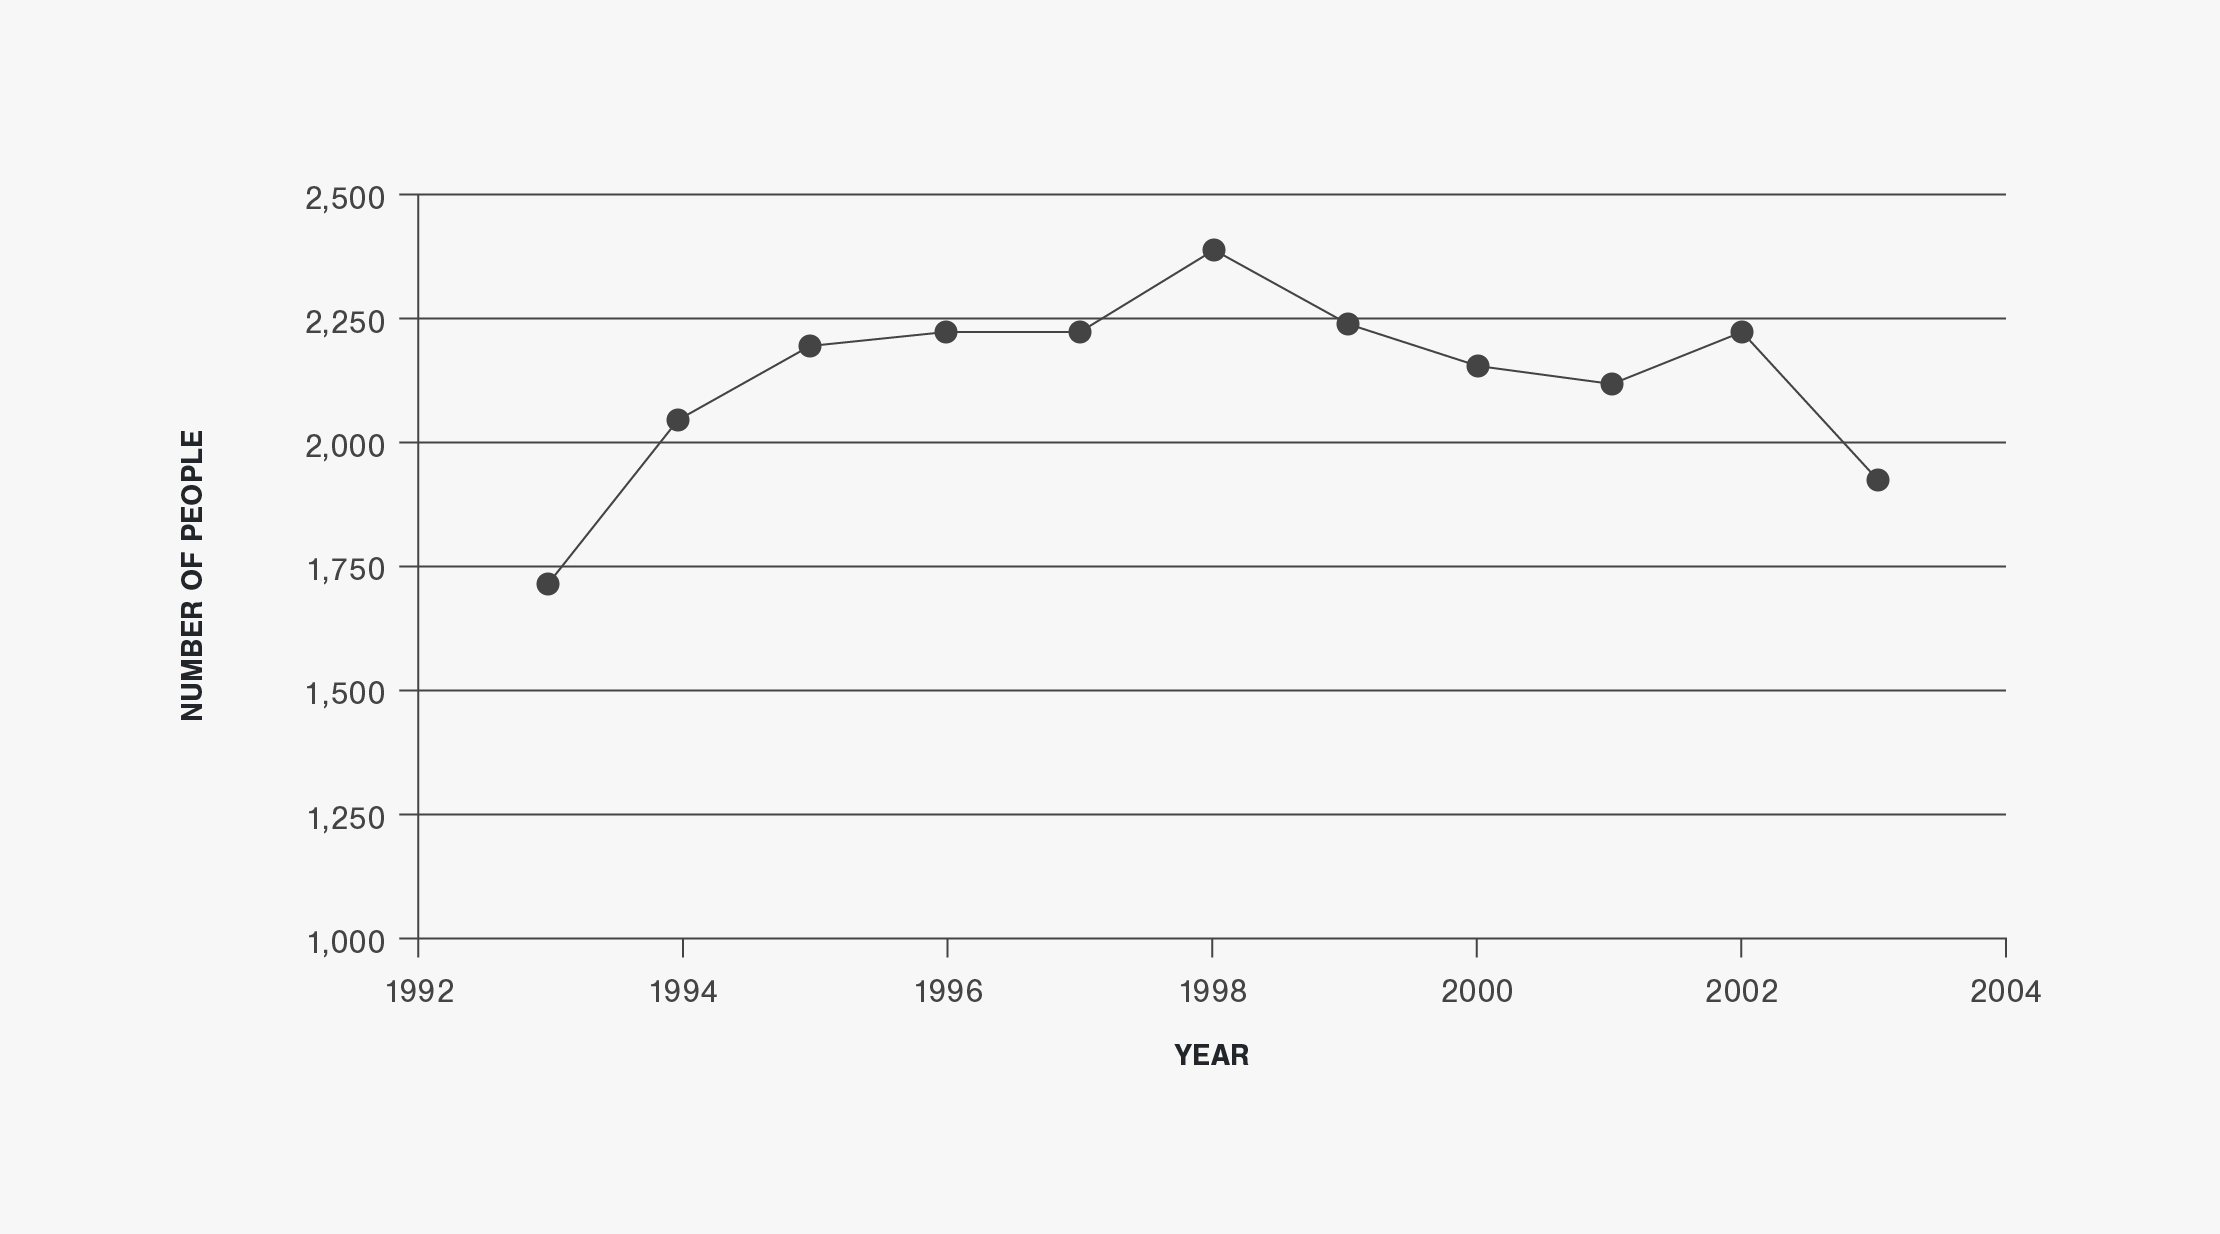
Figure 6 | Deer-Vehicle Crash Rate per 100 Million Vehicle-Miles- Traveled in Michigan (1993 to 2003)
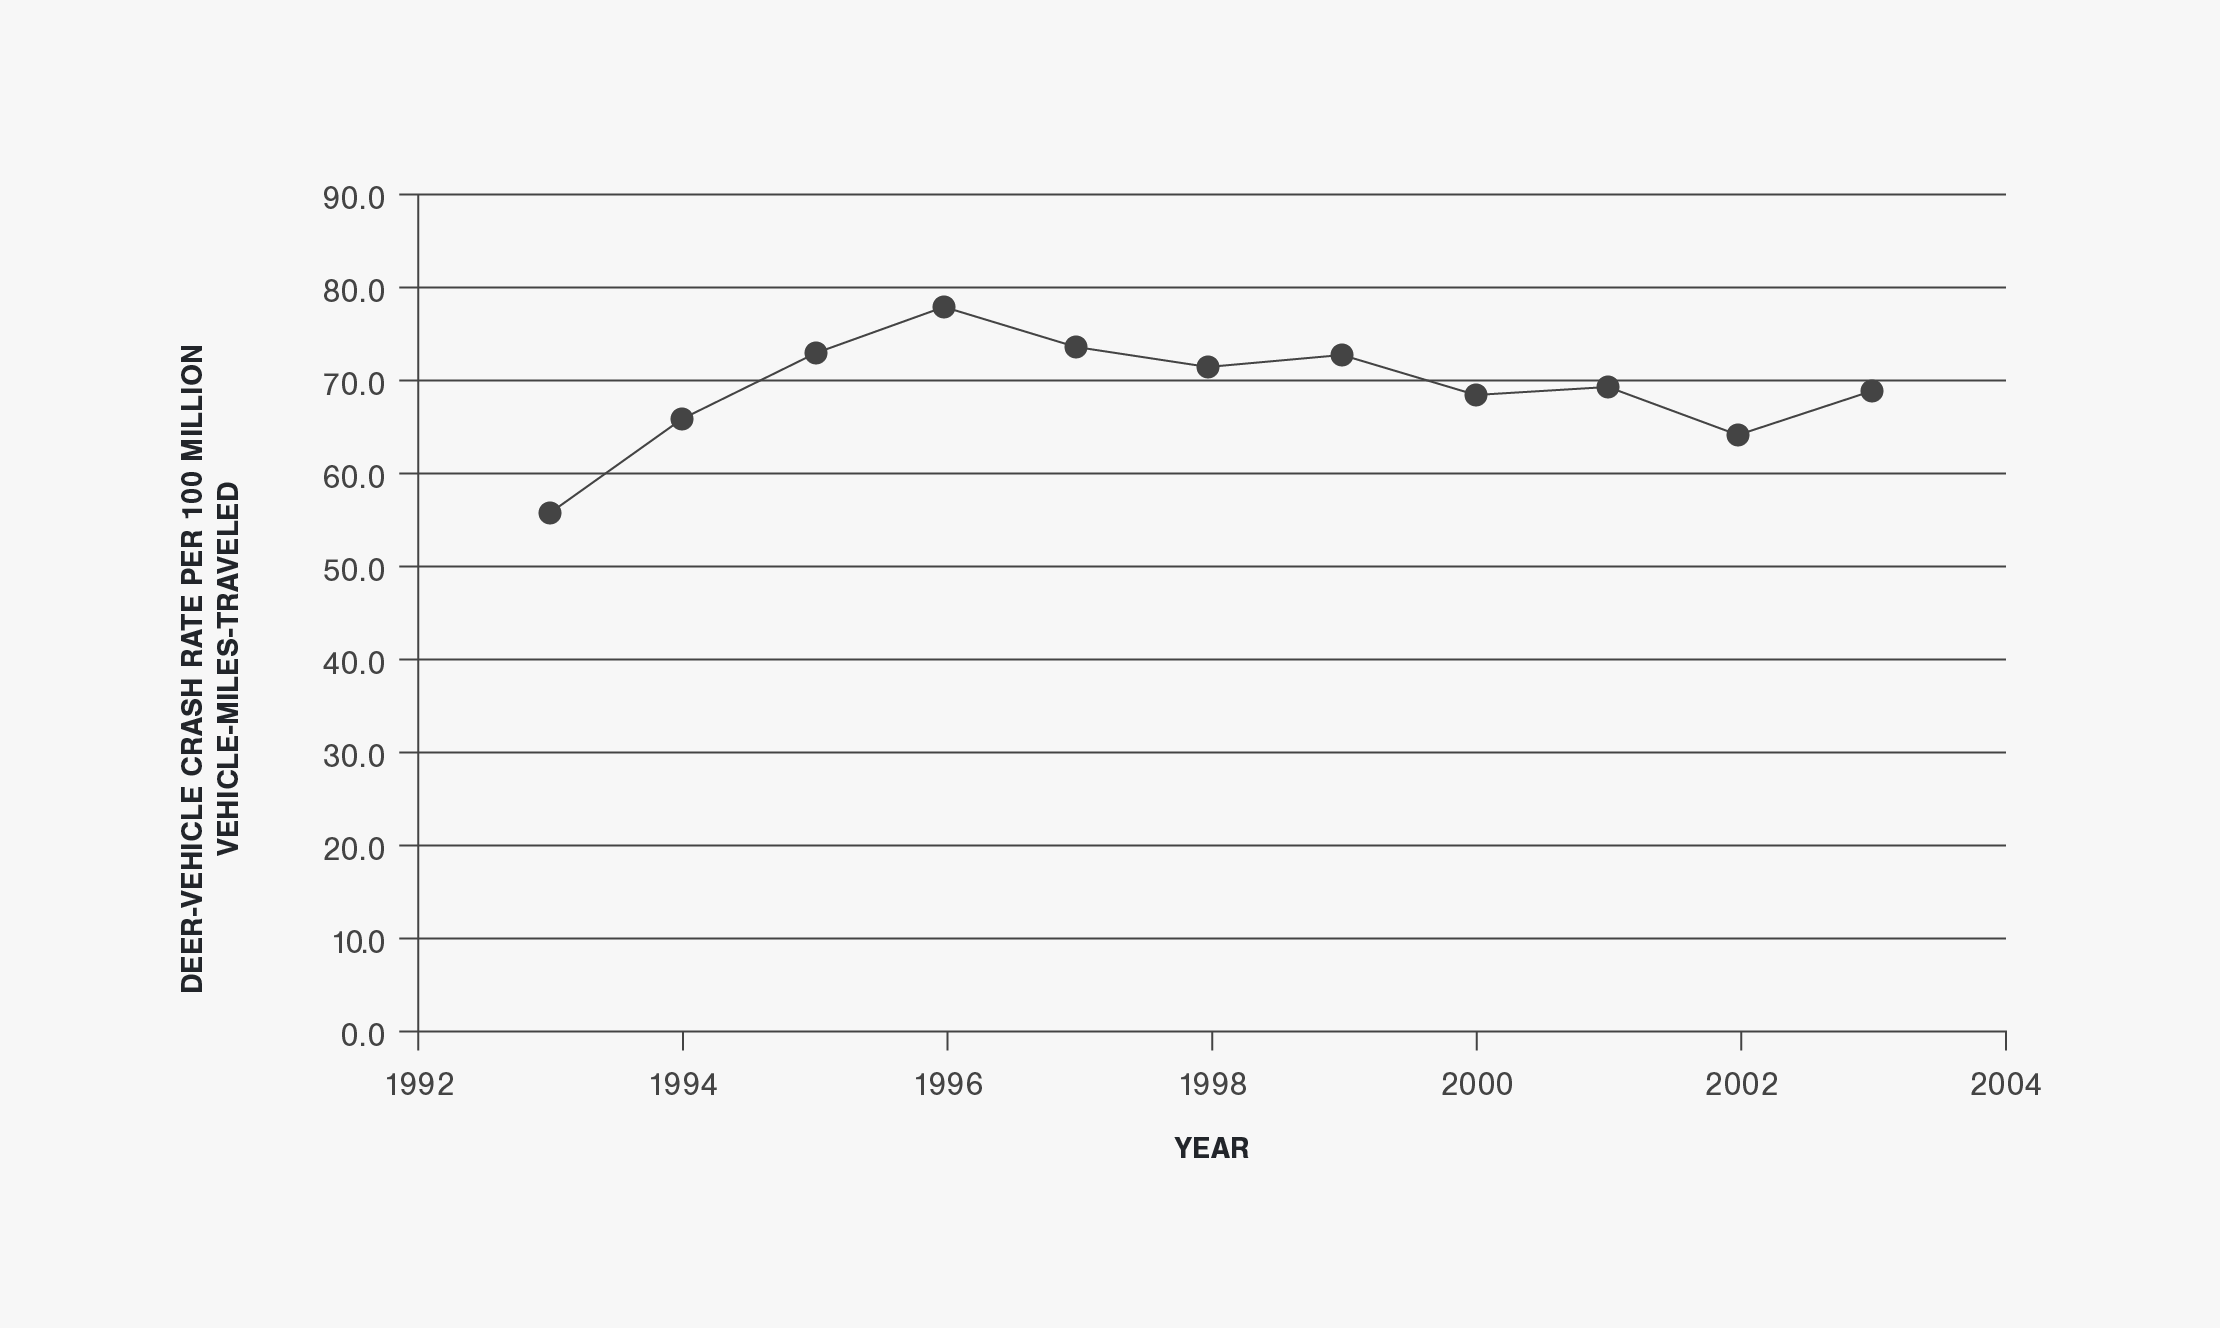
Figure 7 | Pre-Hunt Deer Population Estimates and Deer-Vehicle Crashes in Michigan (1993 to 2003)
Michigan Data Table
Table A-3 | Michigan Deer-Vehicle Crash and Related Data (1993 to 2003)
Minnesota Data
10-Year Report: This report used only a portion of the data available from Minnesota. To view all Minnesota data, including the most recent data available, please visit the Animal-Vehicle Crash Data page.
Minnesota Data Summary
From 1993 to 2002 the average percentage of all crashes reported in Minnesota that were DVCs was approximately 5.6 percent. The annual total number of reported DVCs decreased from 1993 to 1997, but increased somewhat from that year to 2002. The total number of injuries and fatalities due to DVCs, although variable, also increased. Deer are the third most commonly hit object behind striking another vehicle and striking a fixed object in Minnesota (3). An evaluation of the Minnesota DVC-related data showed the following general patterns:
- The annual total number of crashes reported and summarized in Minnesota has fluctuated but been generally stable from 1993 to 2002 (See Figure 1). The total annual number of reported crashes was greatest in 1996 at 105,332, but only 92,926 in 1998. The AVMT in Minnesota has consistently increased during the study time period (See Figure 2).
- There was a decreasing trend in the annual number of DVCs reported in Minnesota from 1993 to 1997, and then an increasing trend from 1997 to 2002 (See Figure 3). The percentage of total crashes represented by DVCs followed a similar pattern. It decreased from 6.5 percent in 1993 to 4.7 percent in 1996, but then increased to 5.9 percent in 2002 (See Figure 4).
- The annual number of fatalities due to DVCs ranged from 1 to 5 between 1993 and 2002. There were a total of 26 DVC fatalities during these 10 years. The annual number of injuries and fatalities due to DVCs has increased from 353 in 1993 to 528 in 2002 (an increase of 49.6 percent). Only fatality crashes were summarized in 2003 and there were also 5 DVC fatalities during that year.
- Similar to the number of DVCs reported, the DVC rate (i.e., the number of DVCs per HMVMT) decreased from 1993 to 1997. However, this safety measure has been relatively stable from 1997 to 2002 (ranging from 10.1 DVCs per HMVMT to 11.0 DVCs per HMVMT). Overall, from 1993 to 2002, the Minnesota DVC rate peaked at 15.4 DVCs per HMVMT in 1993 and was at a minimum of 10.1 DVCs per HMVMT in 2000.
- Minnesota also provided annual deer population estimates from 1994 to 2003 and annual carcass removal numbers from 1993 to 2003 (excluding 1995 due to questions about its validity). Figure 7 shows that the annual deer population estimates have generally increased from 1,004,000 in 1994 to 1,253,000 in 2003 (a 24.8 percent increase). The number of carcasses removed from the roadside, on the other hand, averaged about 2.5 times the number of DVCs reported annually in 1993 and 1994 (when the Minneapolis/St. Paul area maintenance removals were included in the data). This measure averaged about 2.1 from 1996 to 2002 (when the Minneapolis/St. Paul area maintenance removals were not included in the data). The differences between the roadside carcass removal data provided by Minnesota and the reported number of DVCs are shown in Figure 8.
Figures
Figure 1 | Total Crashes Reported in Minnesota (1993 to 2002)
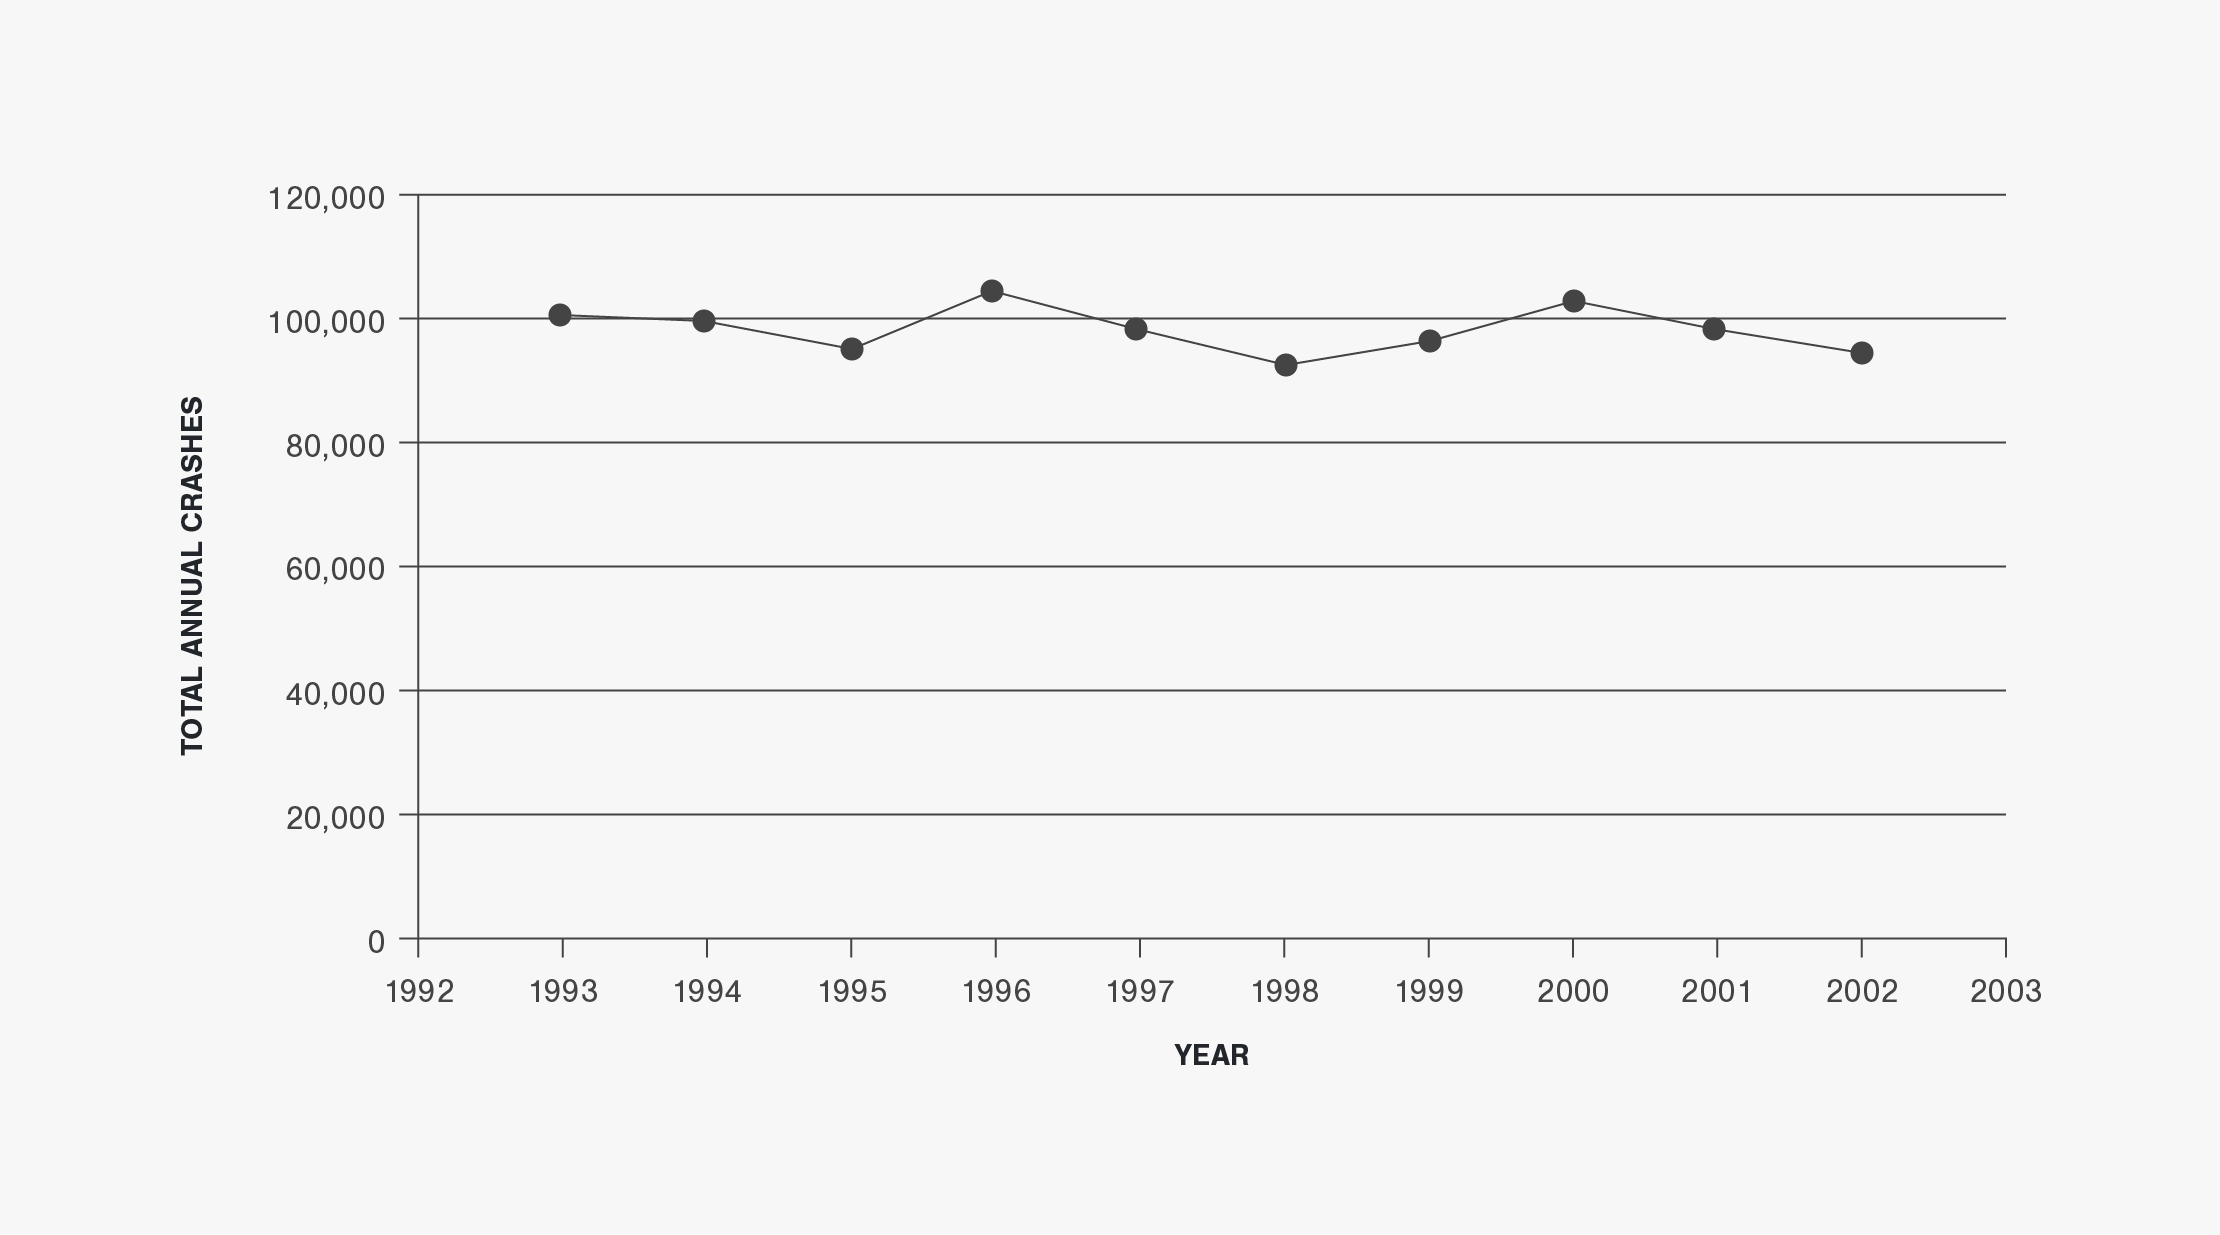
Figure 2 | Annual Vehicle-Miles-Traveled in Minnesota (1993 to 2002)
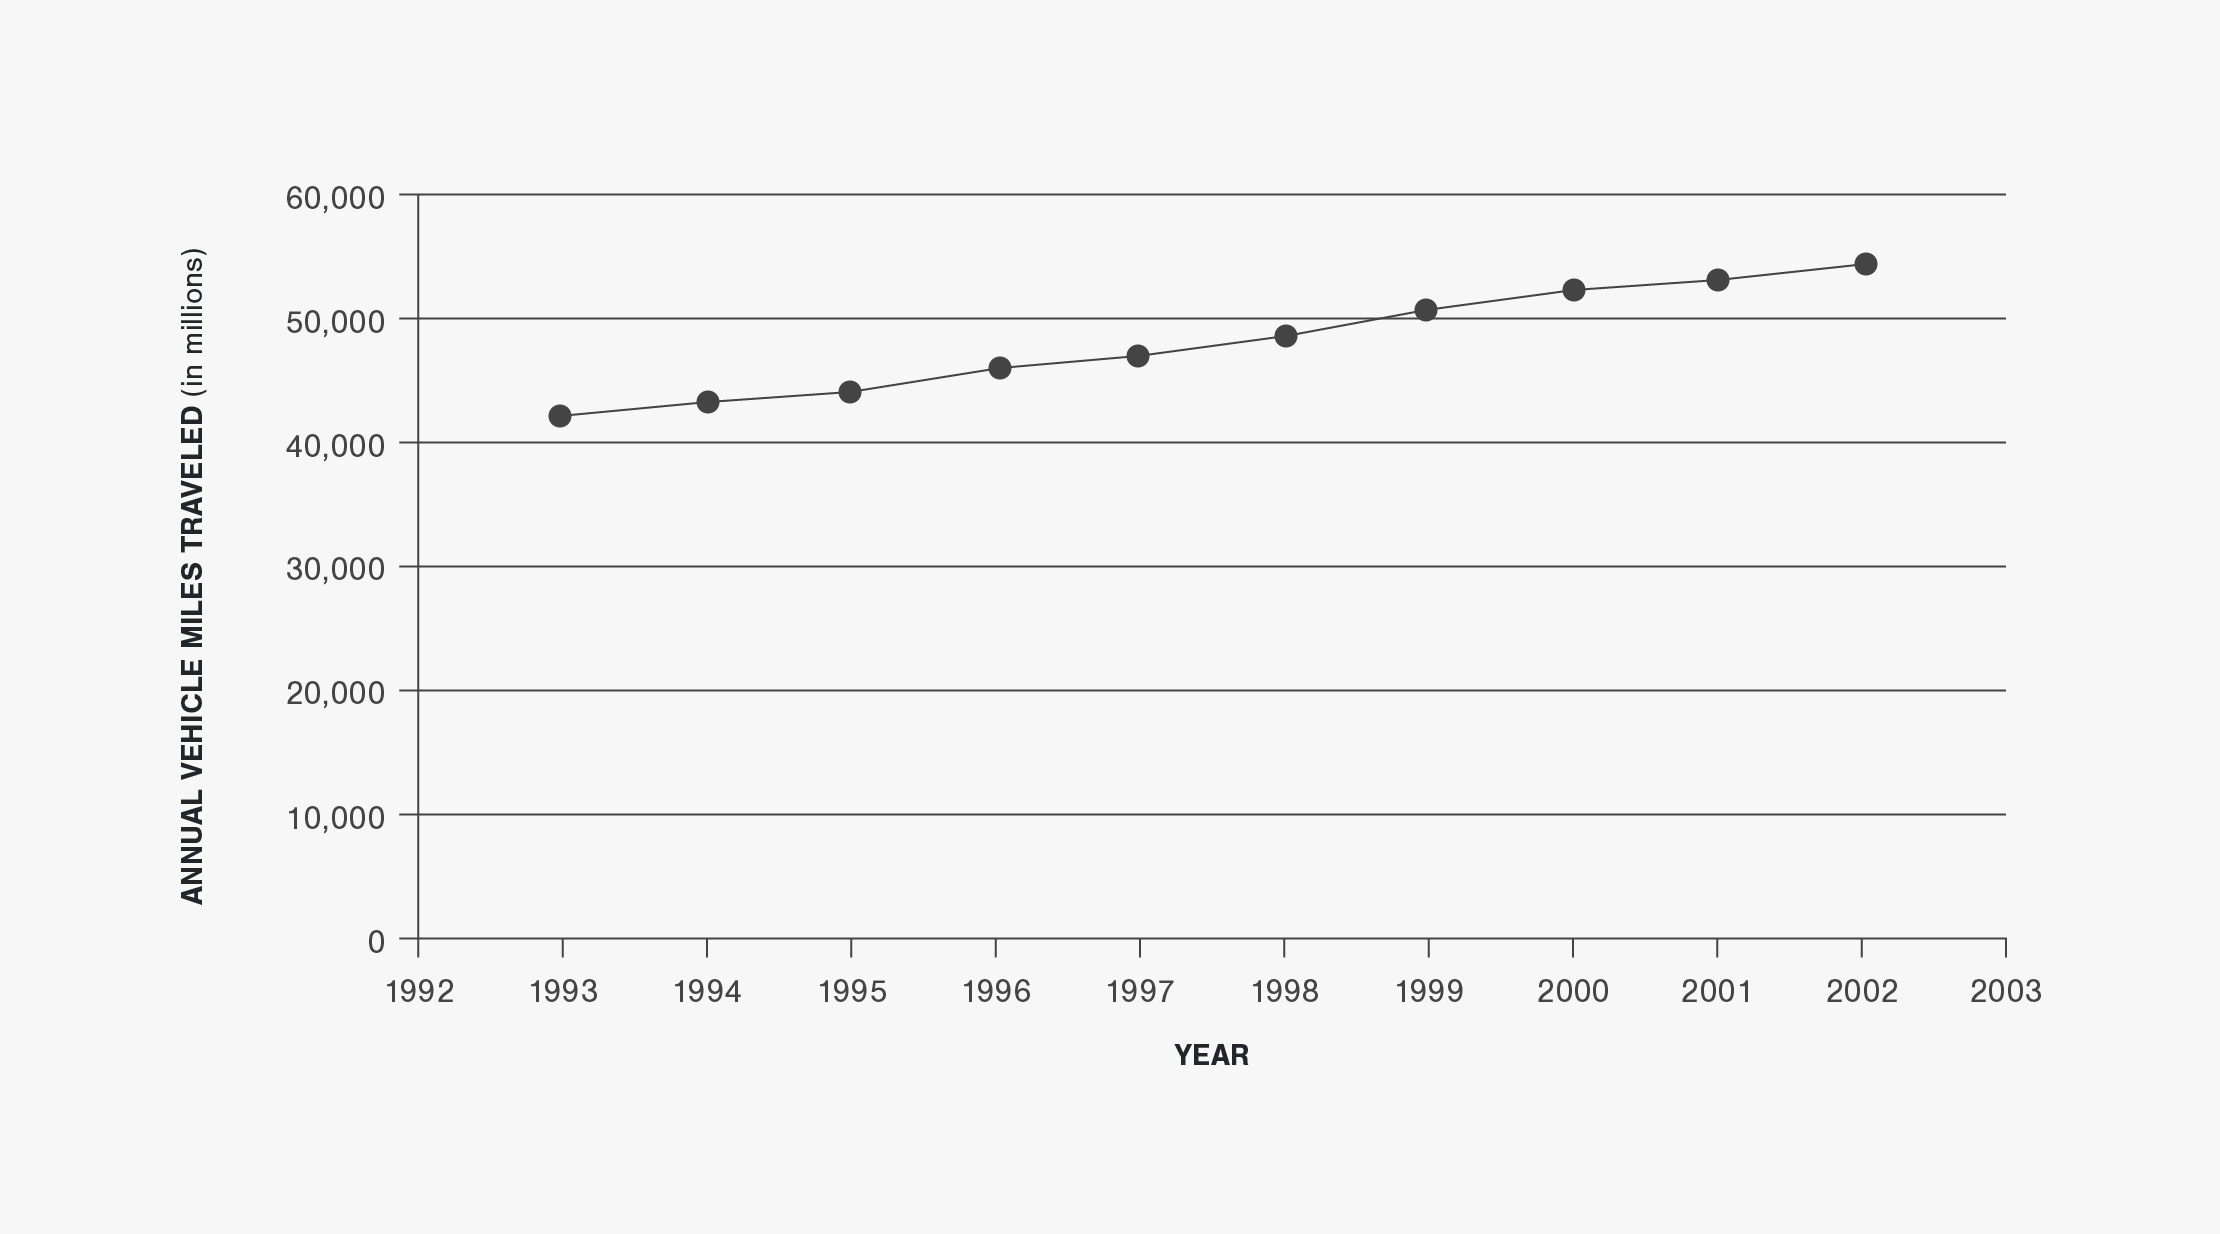
Figure 3 | Reported Deer-Vehicle Crashes in Minnesota (1993 to 2002)
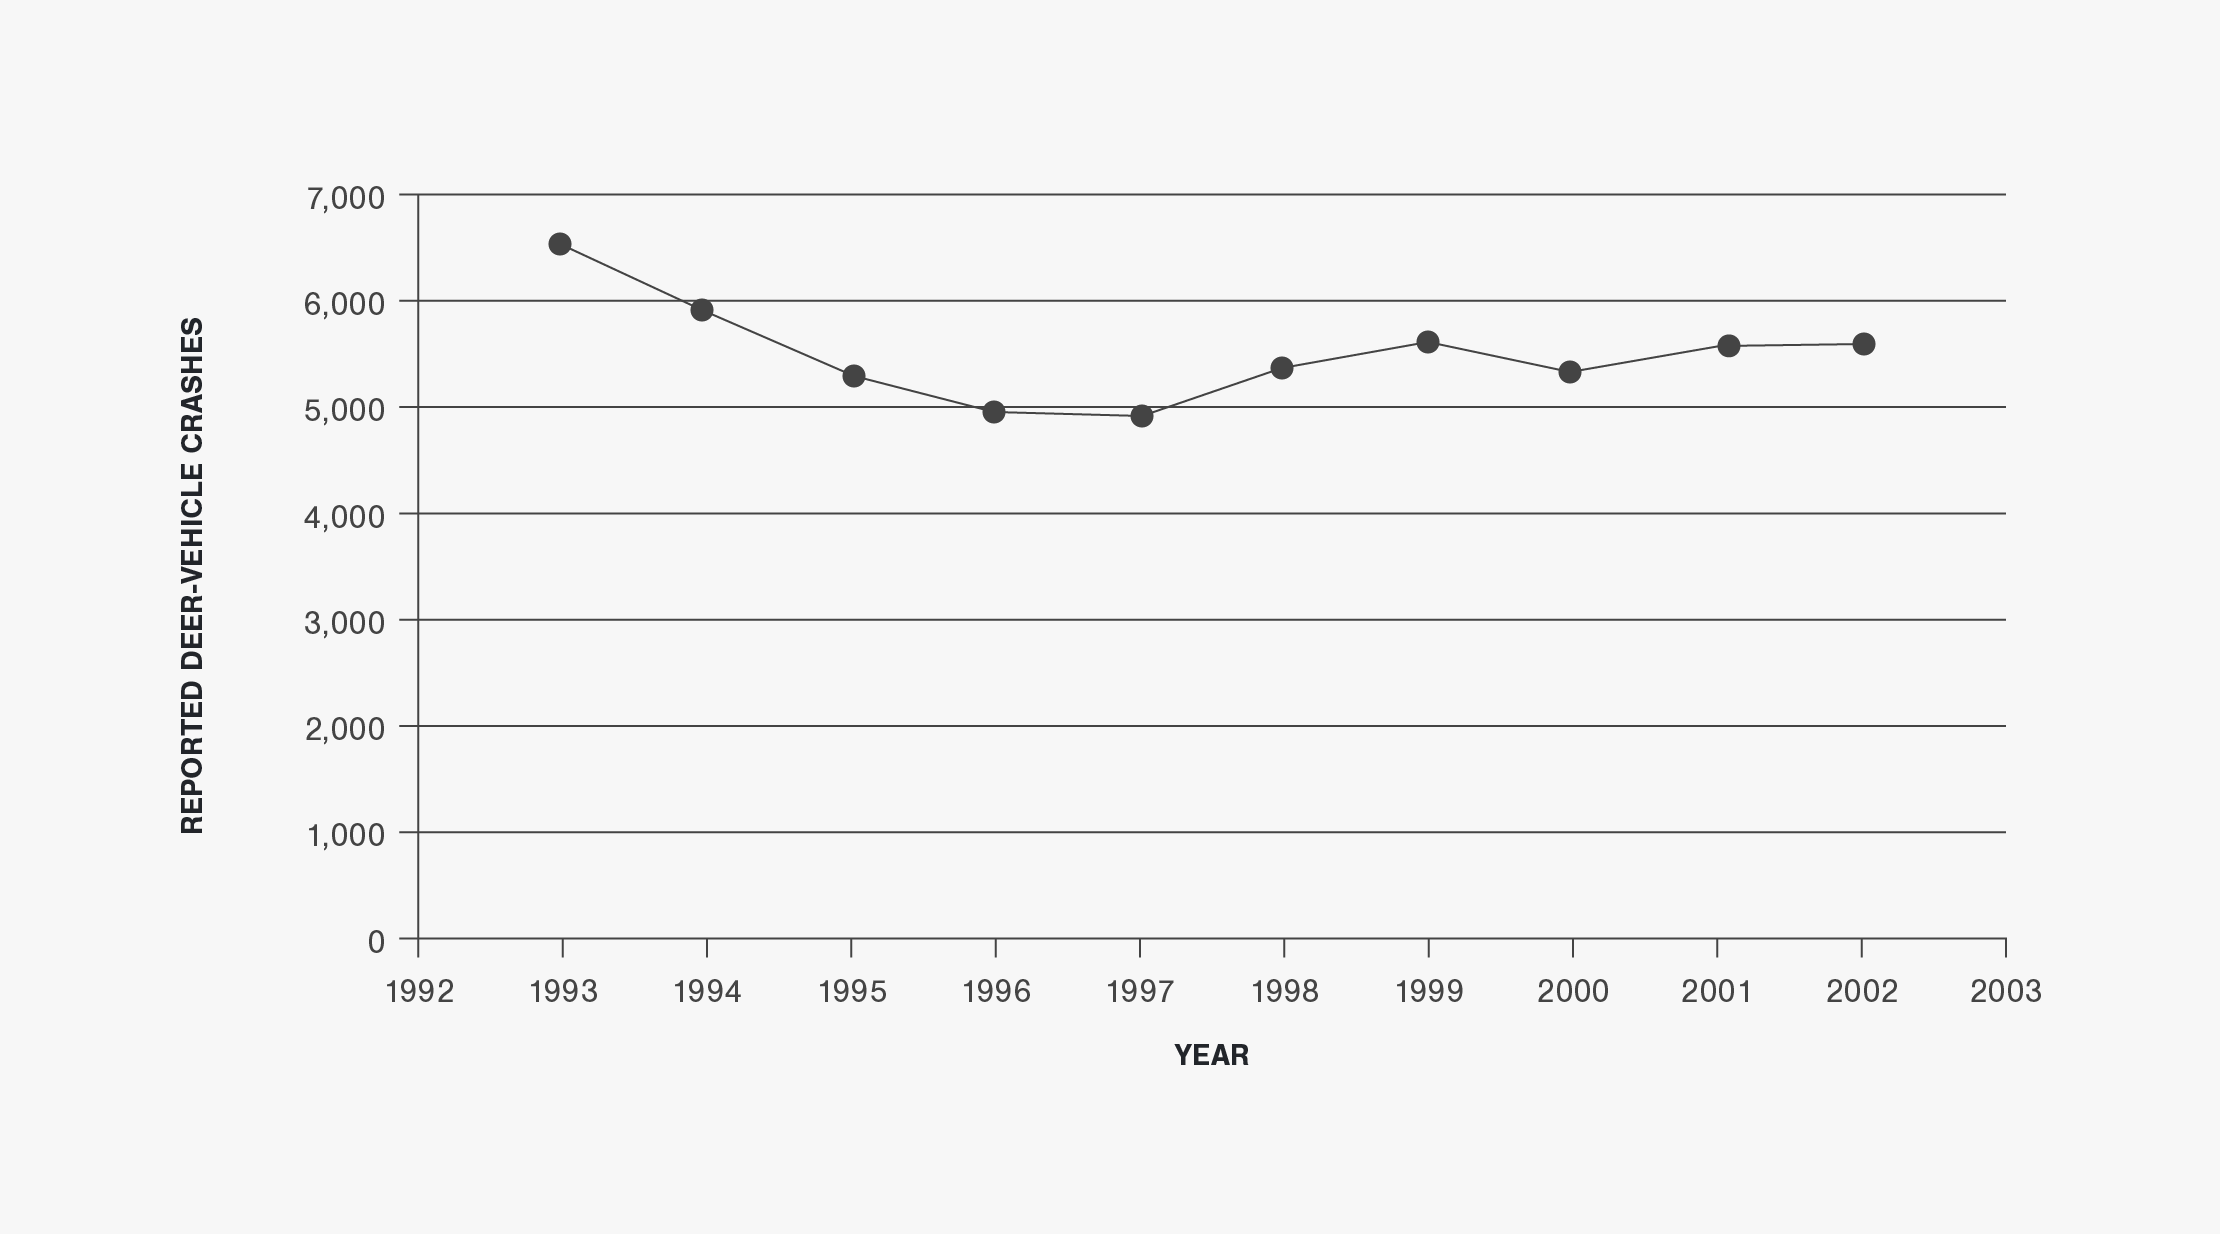
Figure 4 | Percent Deer-Vehicle Crashes in Minnesota (1993 to 2002)
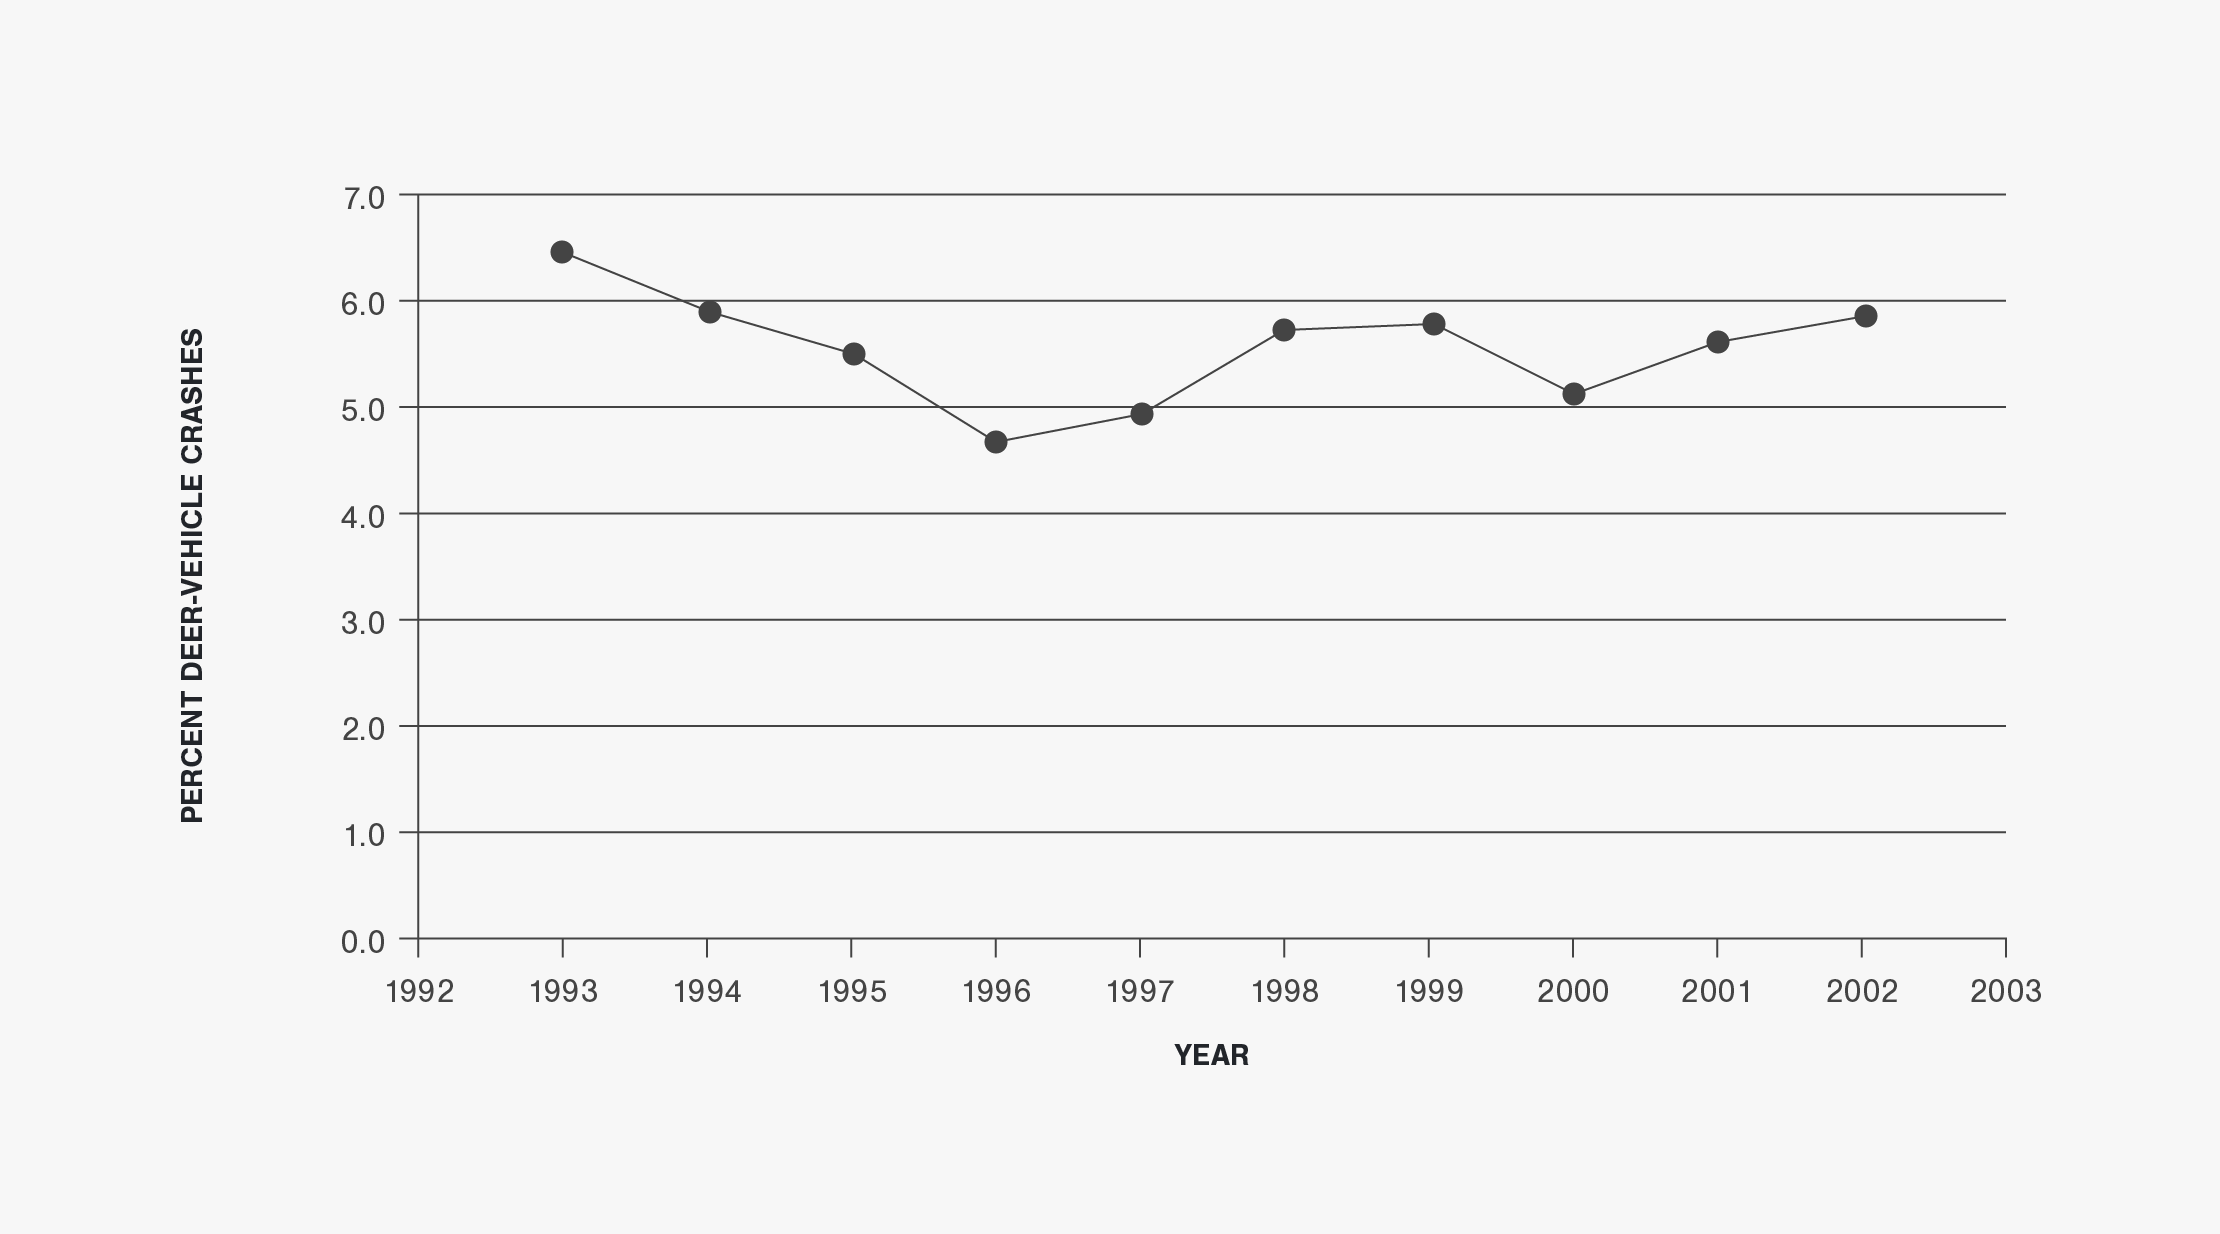
Figure 5 | Number of Deer-Vehicle Crash Fatalities and Injuries in Minnesota (1993 to 2002)
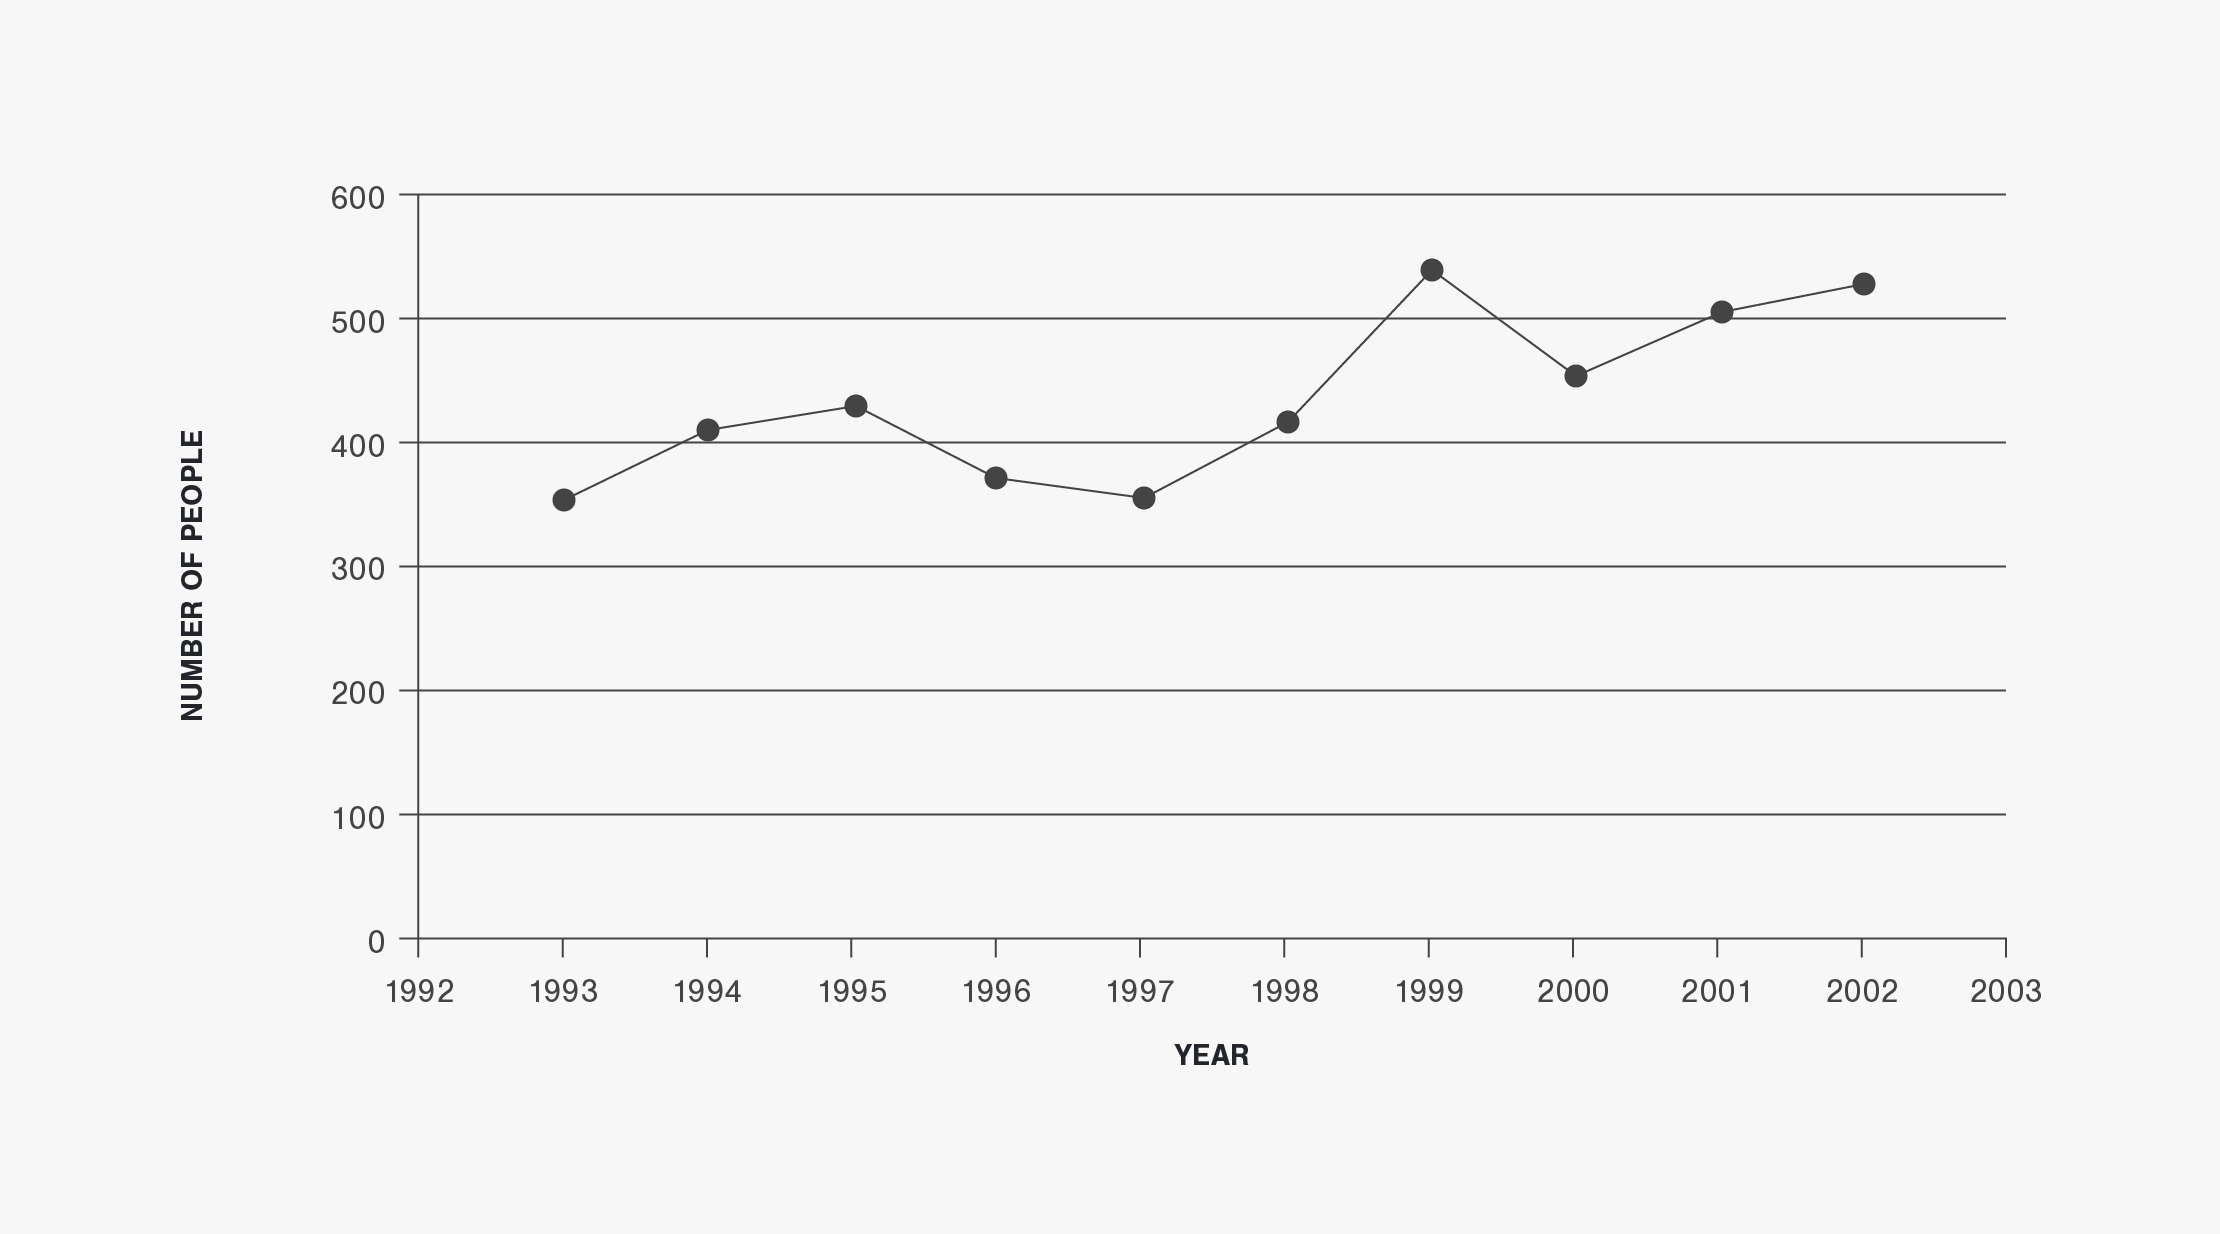
Figure 6 | Deer-Vehicle Crash Rate per 100 Million Vehicle-Miles-Traveled in Minnesota (1993 to 2002)
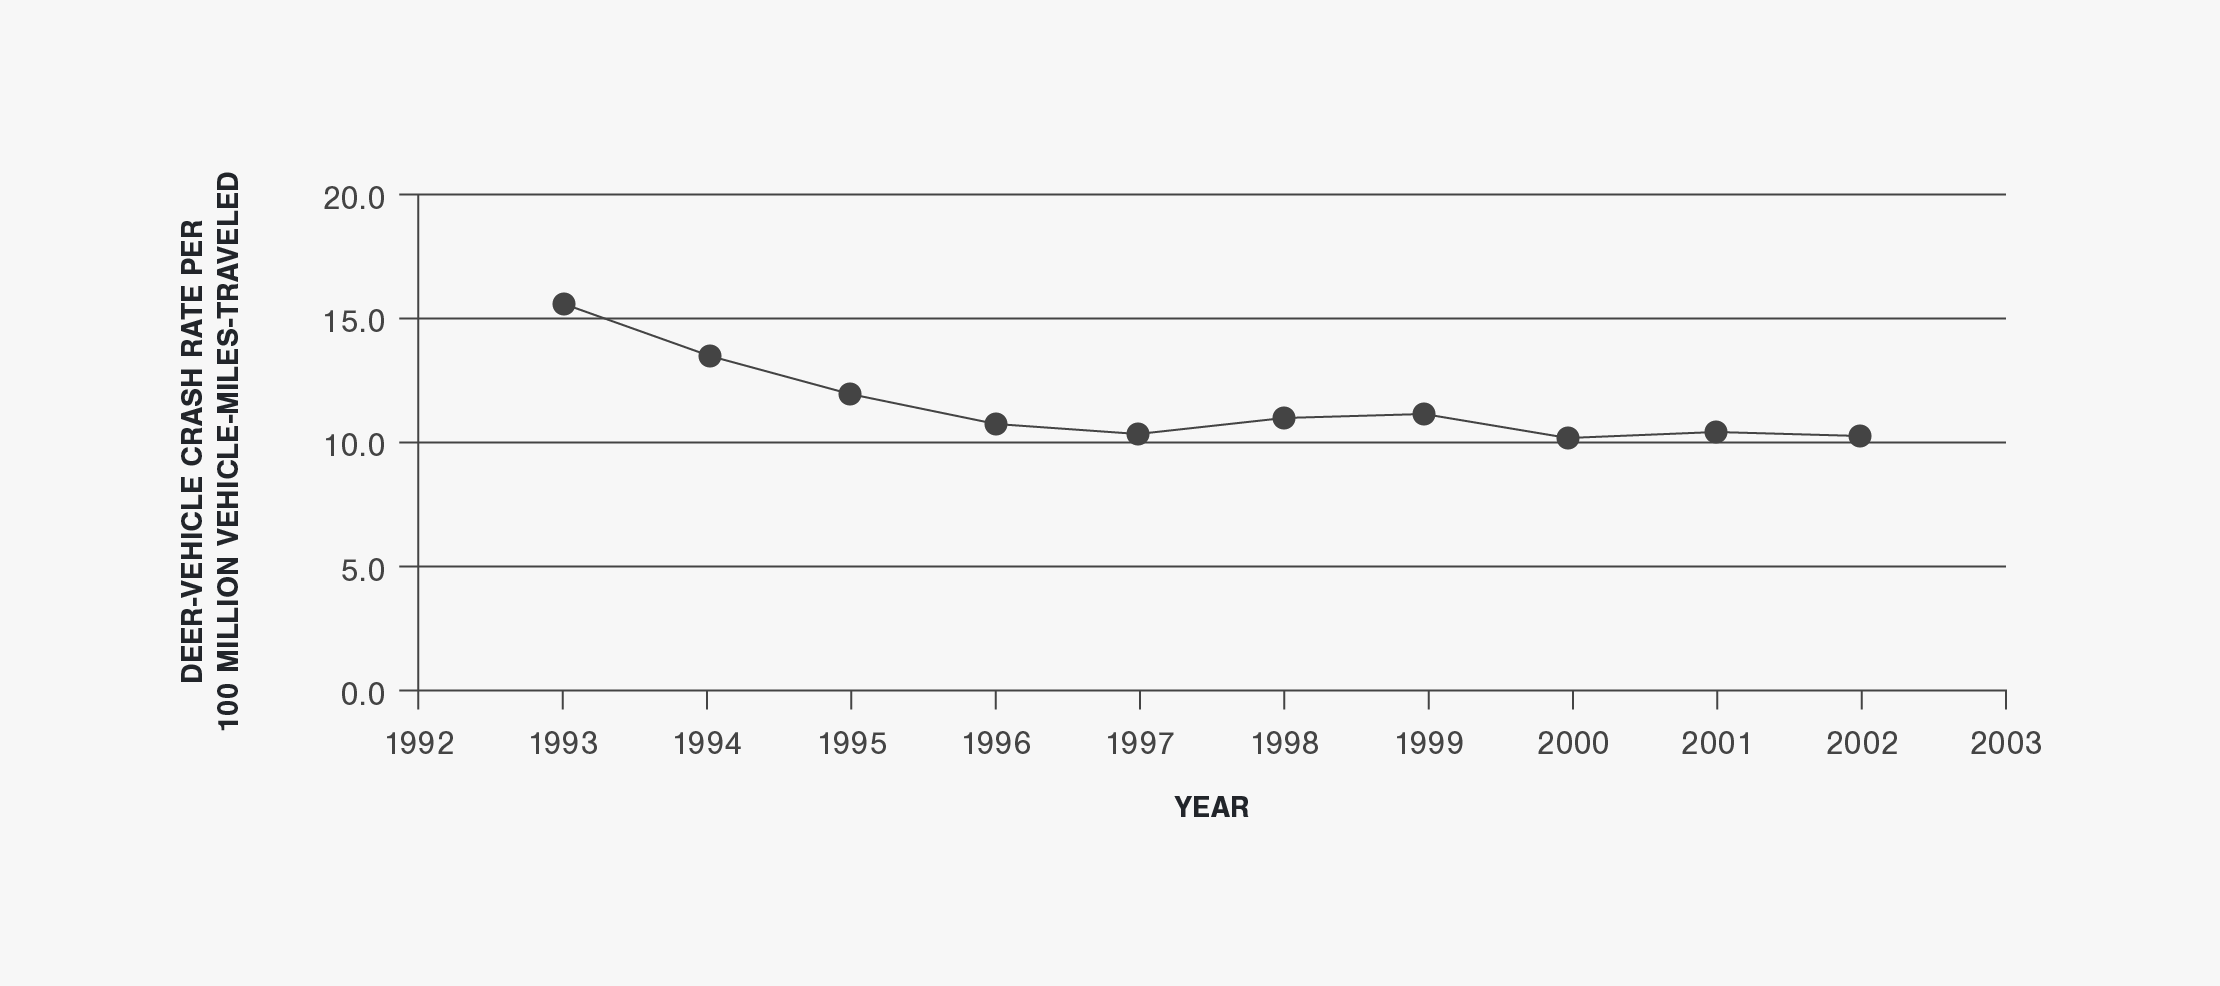
Figure 7 | Pre-Hunt Population Estimates and Deer-Vehicle Crashes in Minnesota (1994 to 2003)
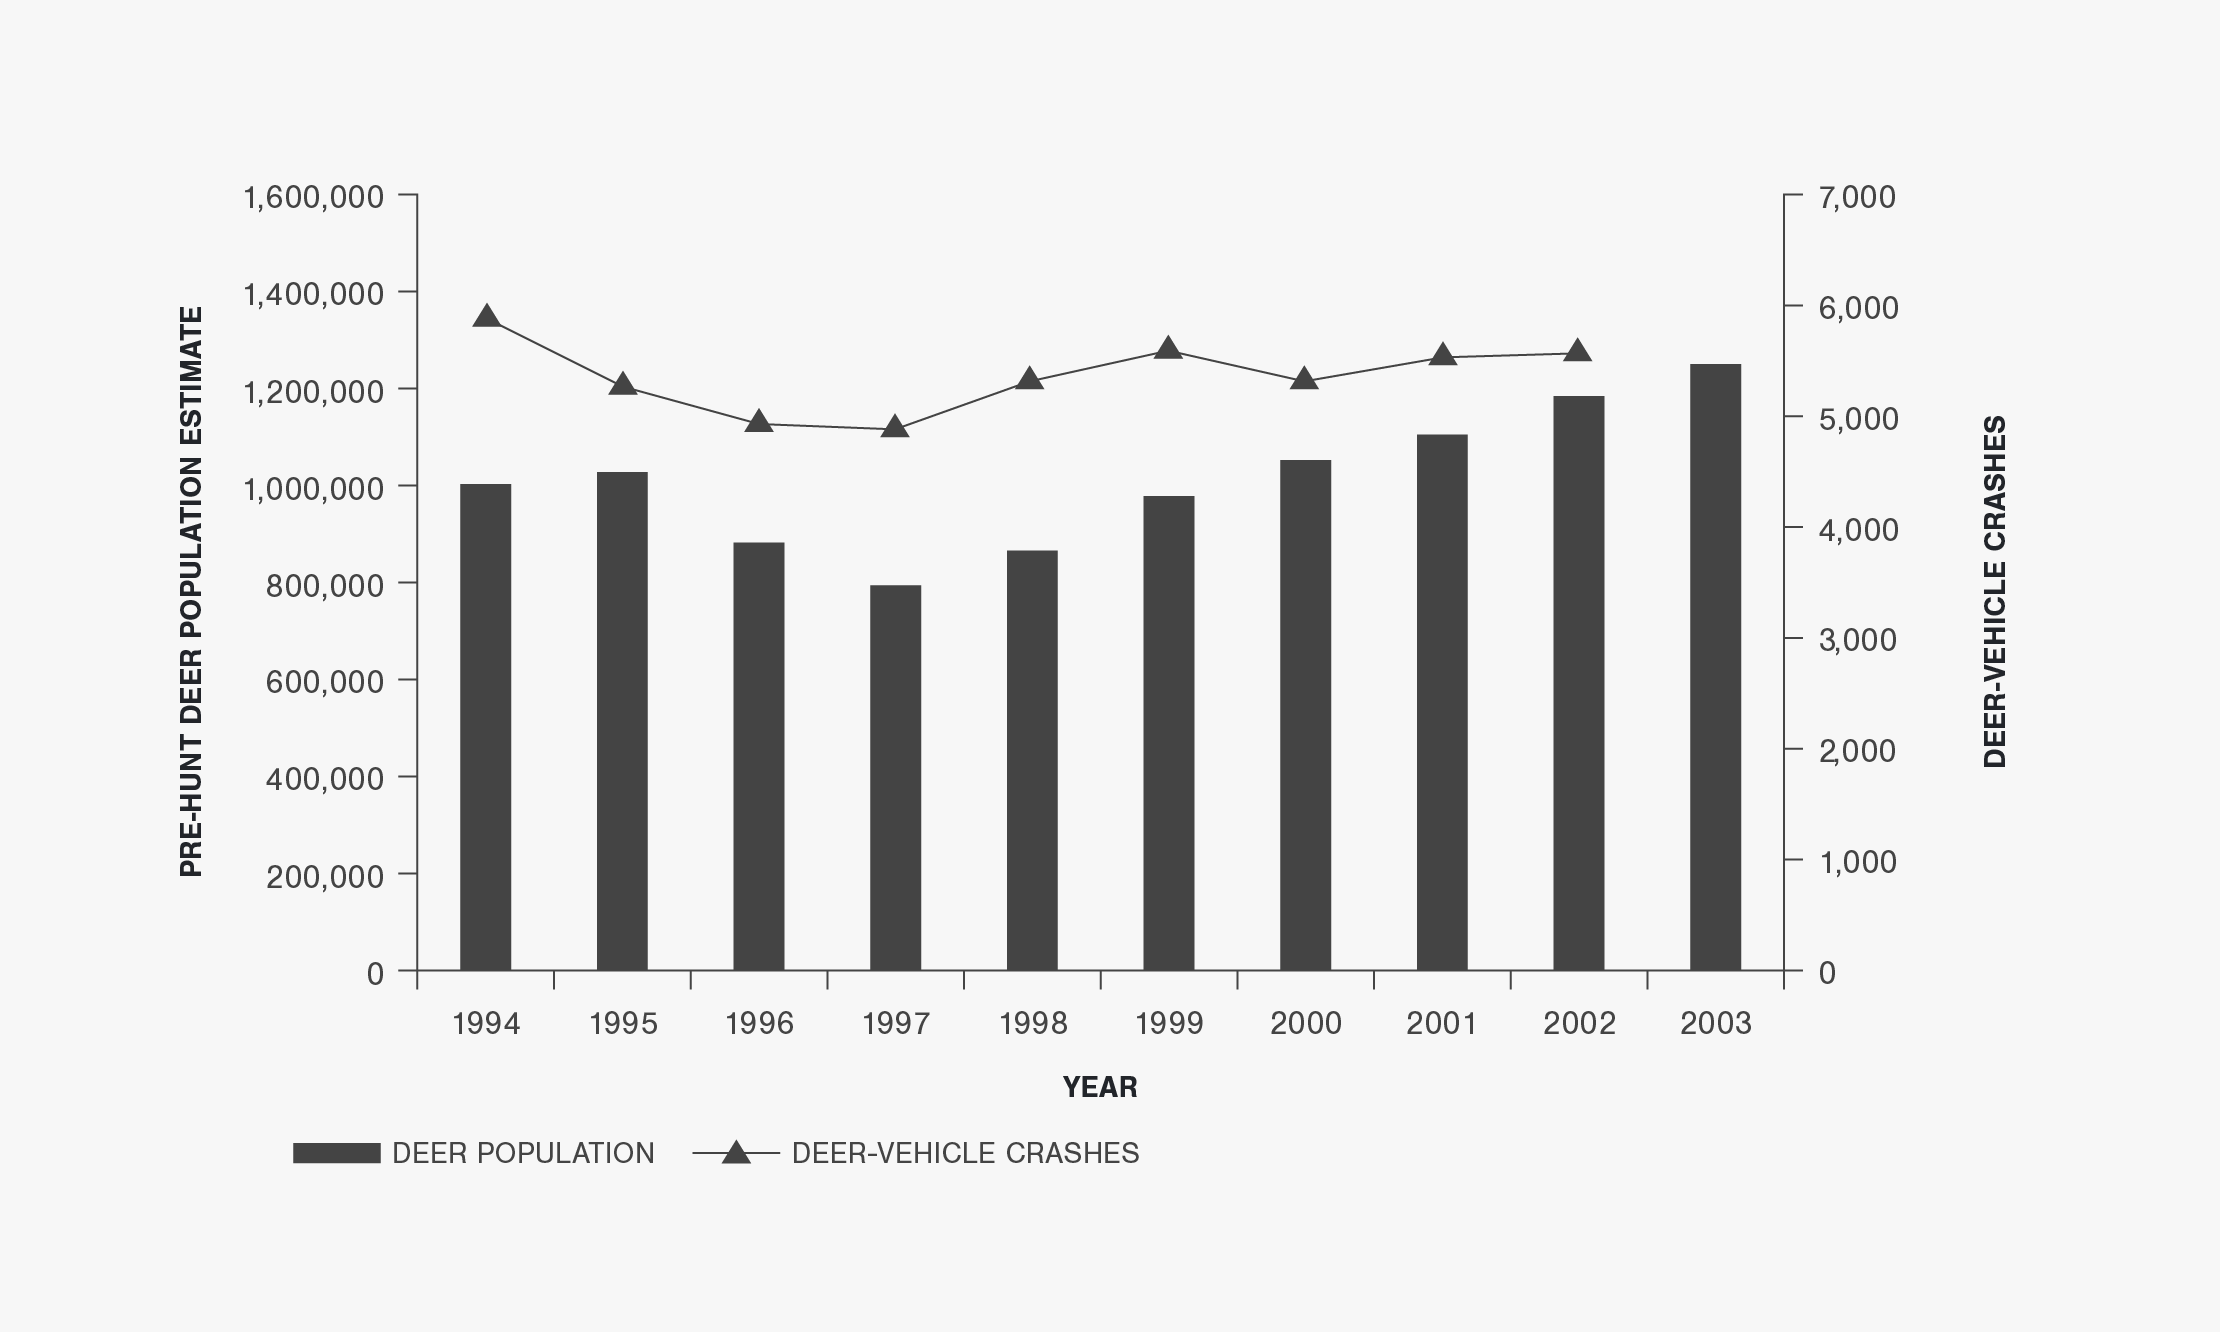
Figure 8 | Roadside Carcass Removals and Reported Deer-Crashes in Minnesota (1993 to 2003)
Minnesota Data Table
Table A-4 | Minnesota Deer-Vehicle Crash and Related Data (1993 to 2003)
a Carcass removal data from 1995 to 2003 does not include the Minneapolis/St. Paul area.
b Minimum property damage reporting threshold changed from $500 to $1,000 on August 1, 1994.
c Carcass removal data from 1995 excluded due to questions about validity.
d Minnesota only summarized fatal crashes in 2003. NA = not available.
Wisconsin Data
10-Year Report: This report used only a portion of the data available from Wisconsin. To view all Wisconsin data, including the most recent data available, please visit the Animal-Vehicle Crash Data page.
Wisconsin Data Summary
From 1993 to 2003 the average annual DVC percentage of all the crashes reported in Wisconsin was approximately 15.7 percent. The annual total number of reported DVCs decreased between 1995 and 1996 (possibly due in part to a change in the Wisconsin crash reporting minimum property damage threshold) and then remained relatively stable from 1996 to 2003. Deer are the third most commonly hit object behind striking another vehicle and striking a fixed object in Wisconsin (4). An evaluation of the Wisconsin DVC-related data showed the following general patterns:
- The annual total number of crashes reported and summarized in Wisconsin has decreased somewhat since 1995 (See Figure 1), but had an increasing trend from 1993 to 1995. The total annual number of reported crashes was greatest in 1995 at 148,864, but only 125,403 in 2001. The AVMT in Wisconsin has consistently increased during the study time period (See Figure 2).
- The annual number of DVCs reported in Wisconsin was relatively stable (with a slight increase) between 1993 and 1995 and then from 1996 to 2003 (See Figure 3). The average annual number of DVCs reported in these two time periods were 23,772 and 20,313, respectively. A 16.7 percent decrease between 1995 and 1996 could be partly due to the change in the crash reporting minimum property damage threshold in Wisconsin (See Figure 4). The percentage of total crashes represented by DVCs, however, has remained relatively stable from 1993 to 2003 (although it did decrease somewhat between 1995 and 1996). The maximum annual DVC percentage was 16.6 percent in 1994 (the DVC percentage in 2003 was slightly smaller at 16.5 percent), and the minimum annual DVC percentage was 14.6 percent in 1996.
- The annual number of fatalities due to DVCs ranged from 3 to 13 between 1993 and 2003. There was a total of 70 DVC fatalities during these 11 years. The number of injuries and fatalities due to DVCs increased from 570 in 1993 to 798 in 1994 (an increase of 40 percent), but then averaged 796 between 1994 and 2003. The annual number of DVC injuries and fatalities reported from 1994 to 2003 has only ranged from 716 to 847.
- Similar to the number of DVCs reported, the DVC rate (i.e., the number of DVCs per HMVMT) in Wisconsin was relatively stable from 1993 to 1995 and then from 1996 to 2003 (See Figure 35). The average DVC rates in these two time periods were 47.4 DVCs per HMVMT and 36.0 DVCs per HMVMT, respectively. The 18.6 percent decrease between 1995 and 1996 could be partly due to the change in the crash reporting minimum property damage threshold in Wisconsin (See Figure 6). Overall, from 1993 to 2003, the Wisconsin DVC rate peaked at 48.9 DVCs per HMVMT in 1994 and was at a minimum of 34.8 DVCs per HMVMT in 2001.
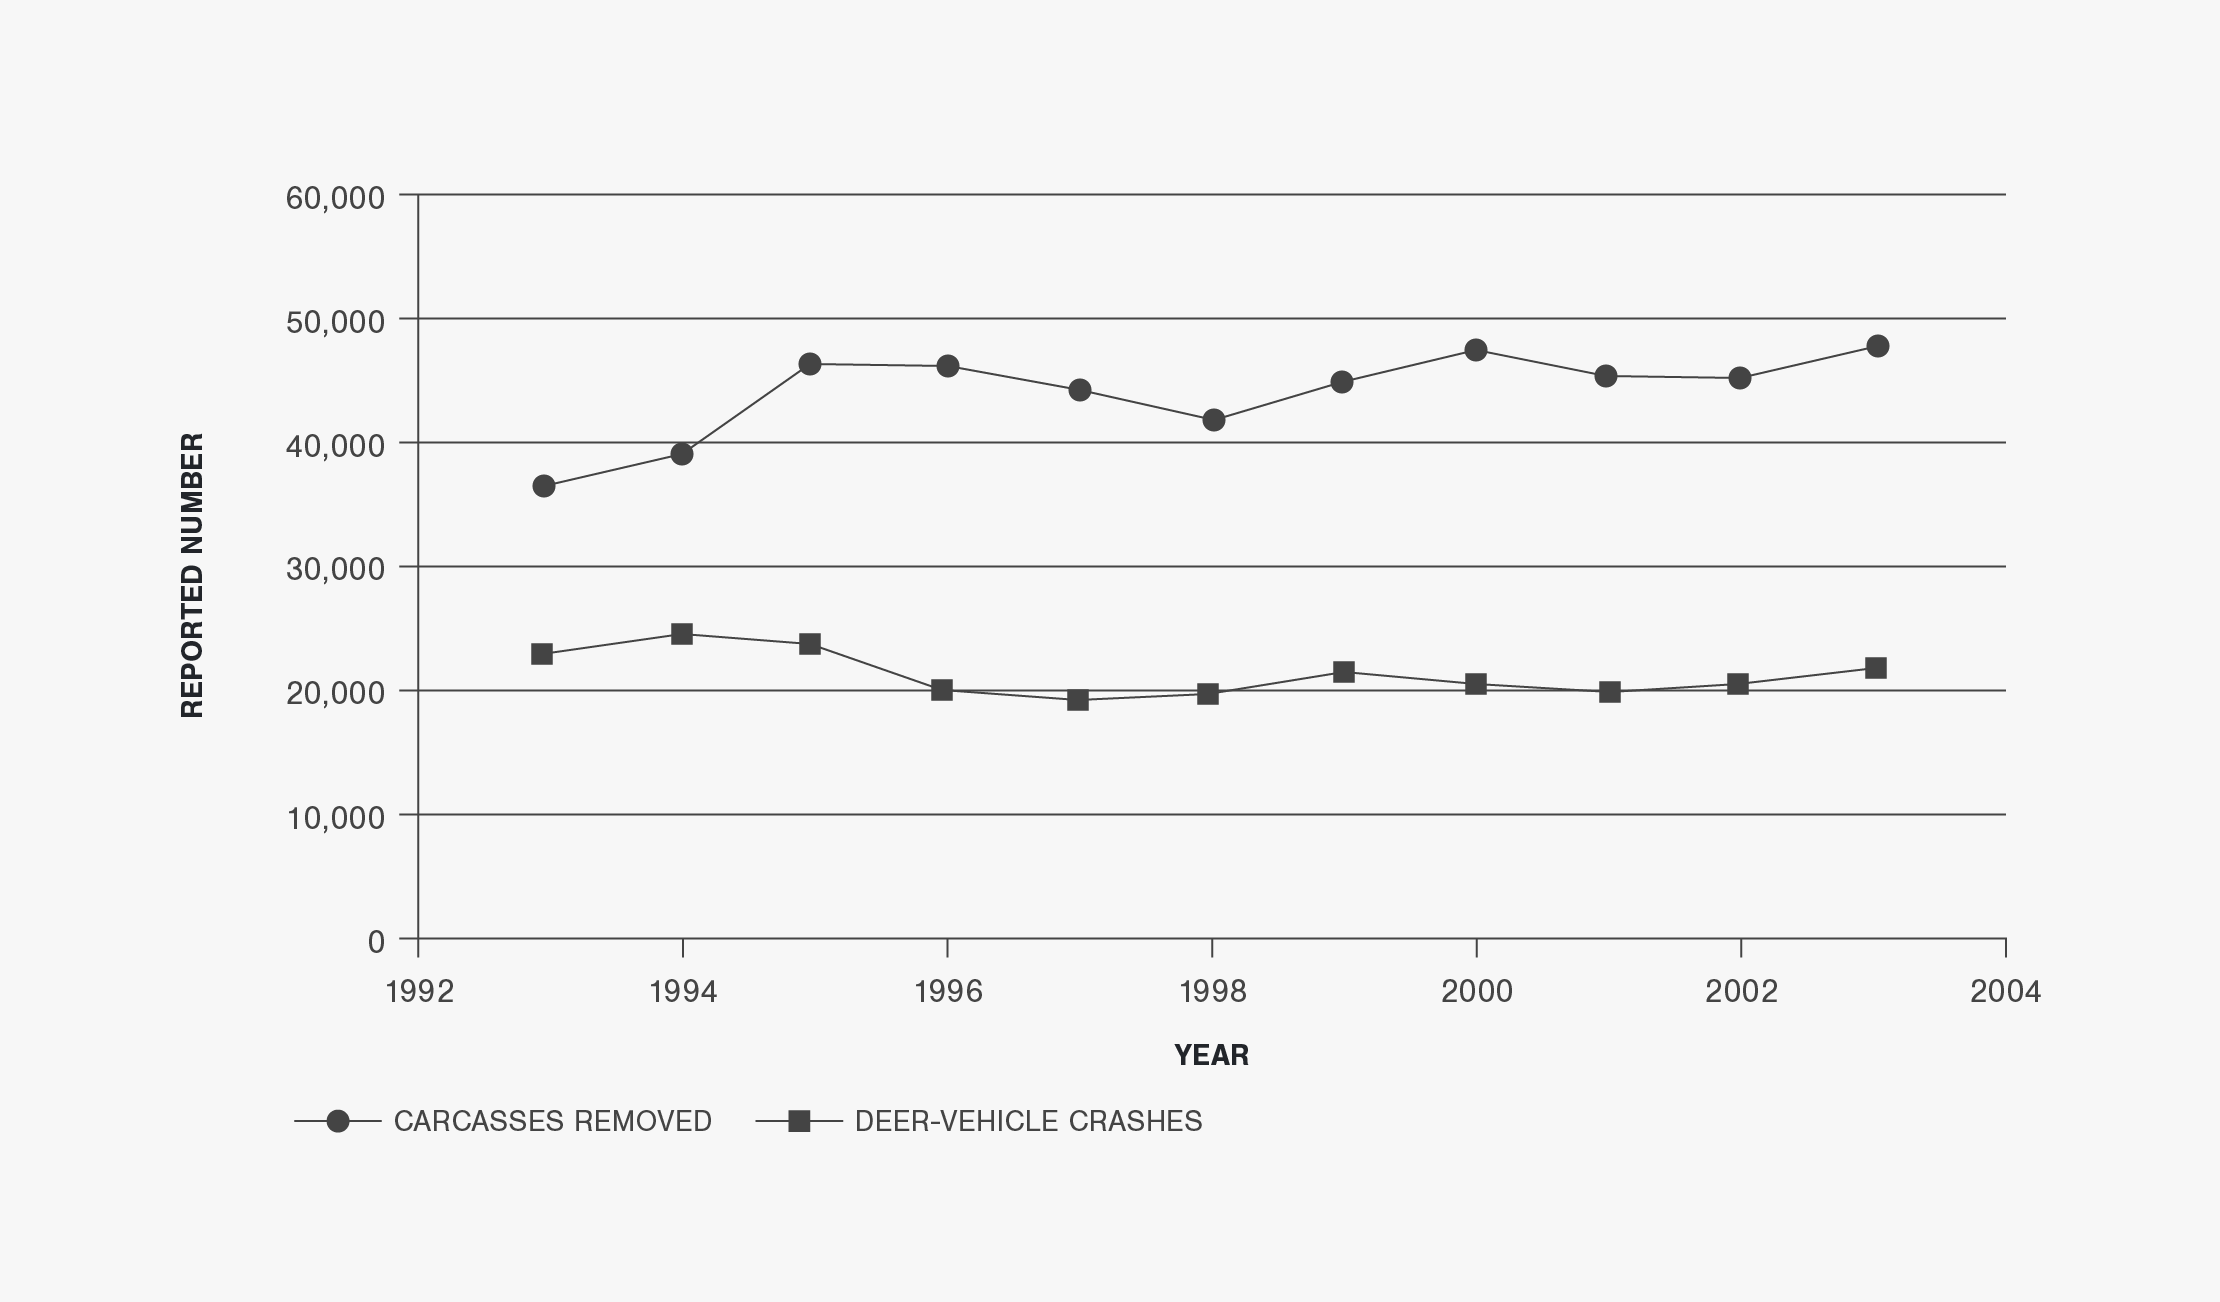
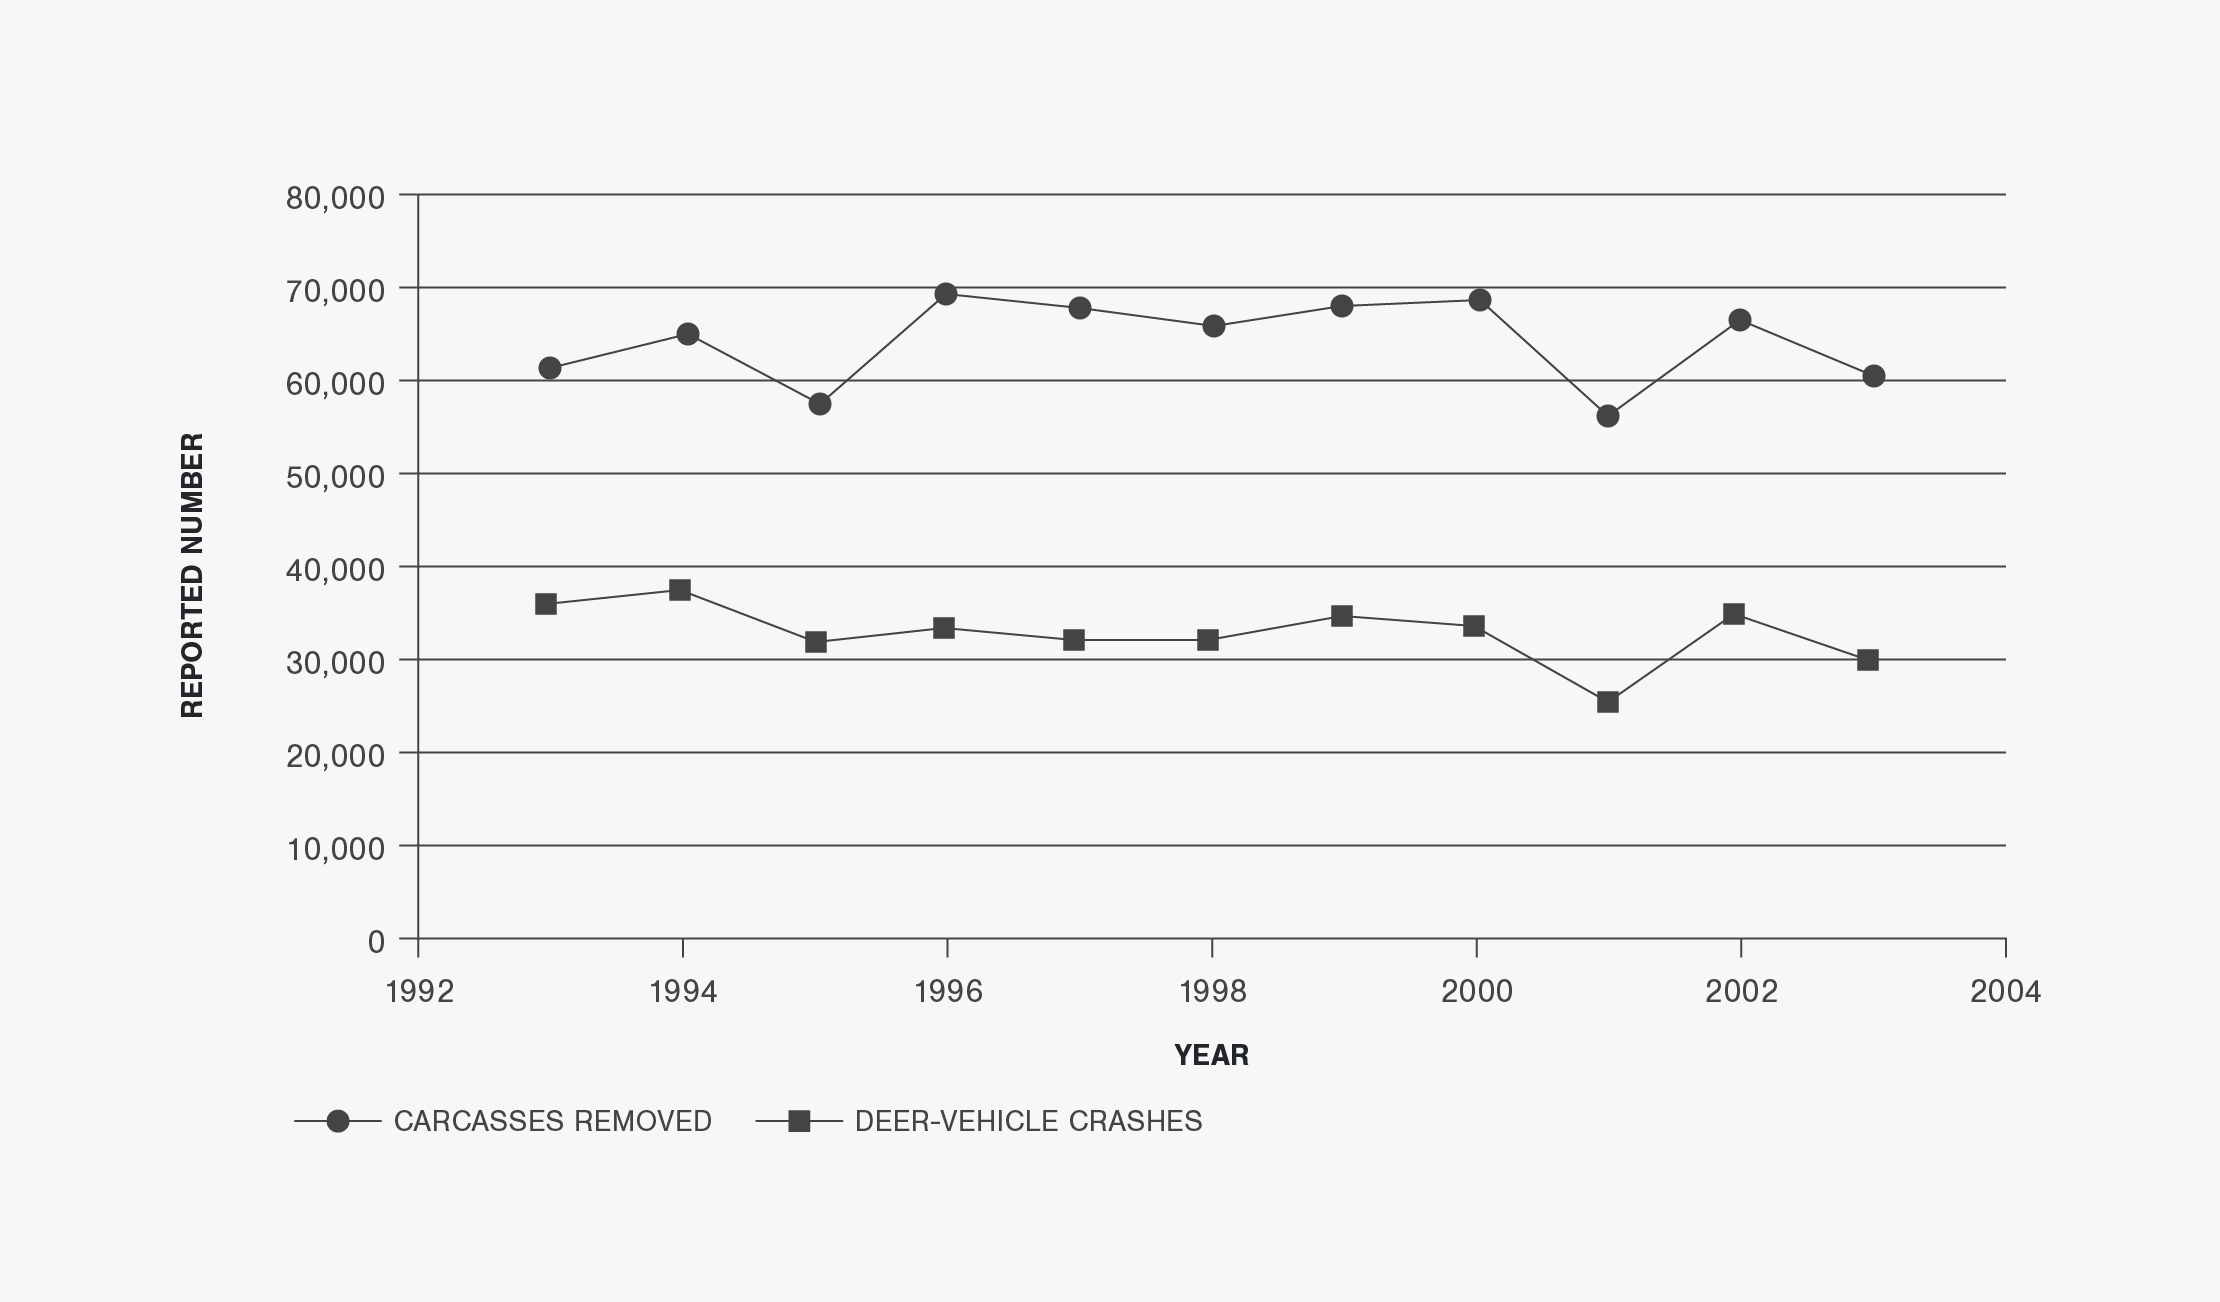
- Wisconsin also provided annual deer population estimates and carcass removal numbers from 1993 to 2003. Figure 7 shows that the annual deer population estimates have generally increased from 1,152,000 deer in 1993 to 1,663,000 deer in 2003 (an increase of 44.4 percent). The minimum deer population estimate was 1,152,000 in 1993, and the maximum 1,818,000 in 2000. The number of carcasses removed from the roadside, on the other hand, increased from 36,787 in 1993 to 47,841 in 2003. The number of carcasses removed was about 1.6 to 2.3 times the number of DVCs reported annually from 1993 to 2003. The average of this measure was 2.1.
Figures
Figure 1 | Total Crashes Reported in Wisconsin (1993 to 2003)
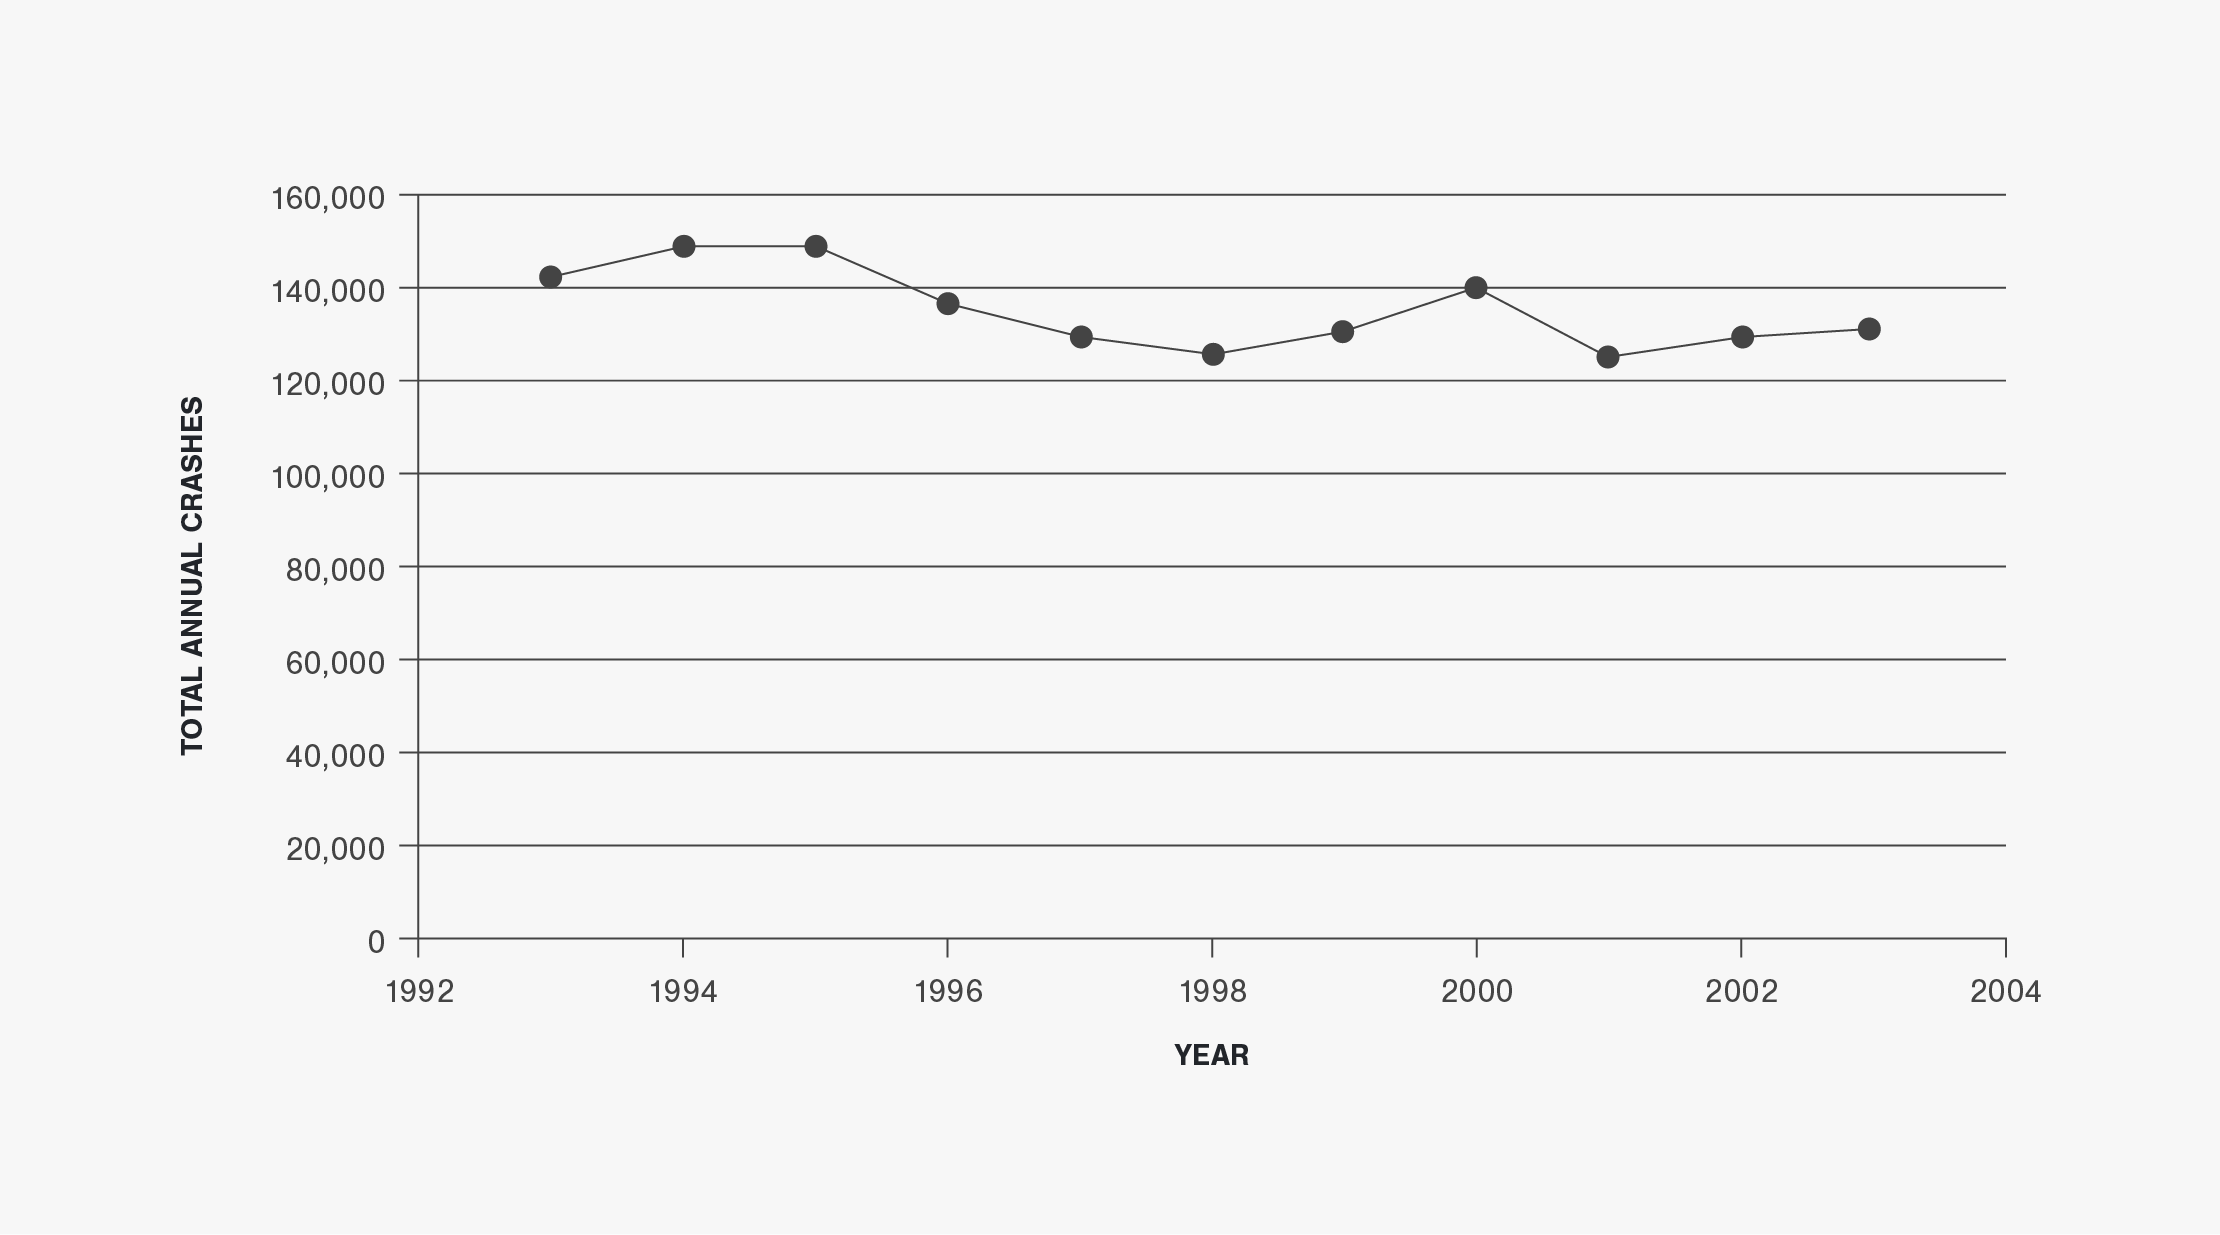
Figure 2 | Annual Vehicle-Miles-Traveled in Wisconsin (1993 to 2003)
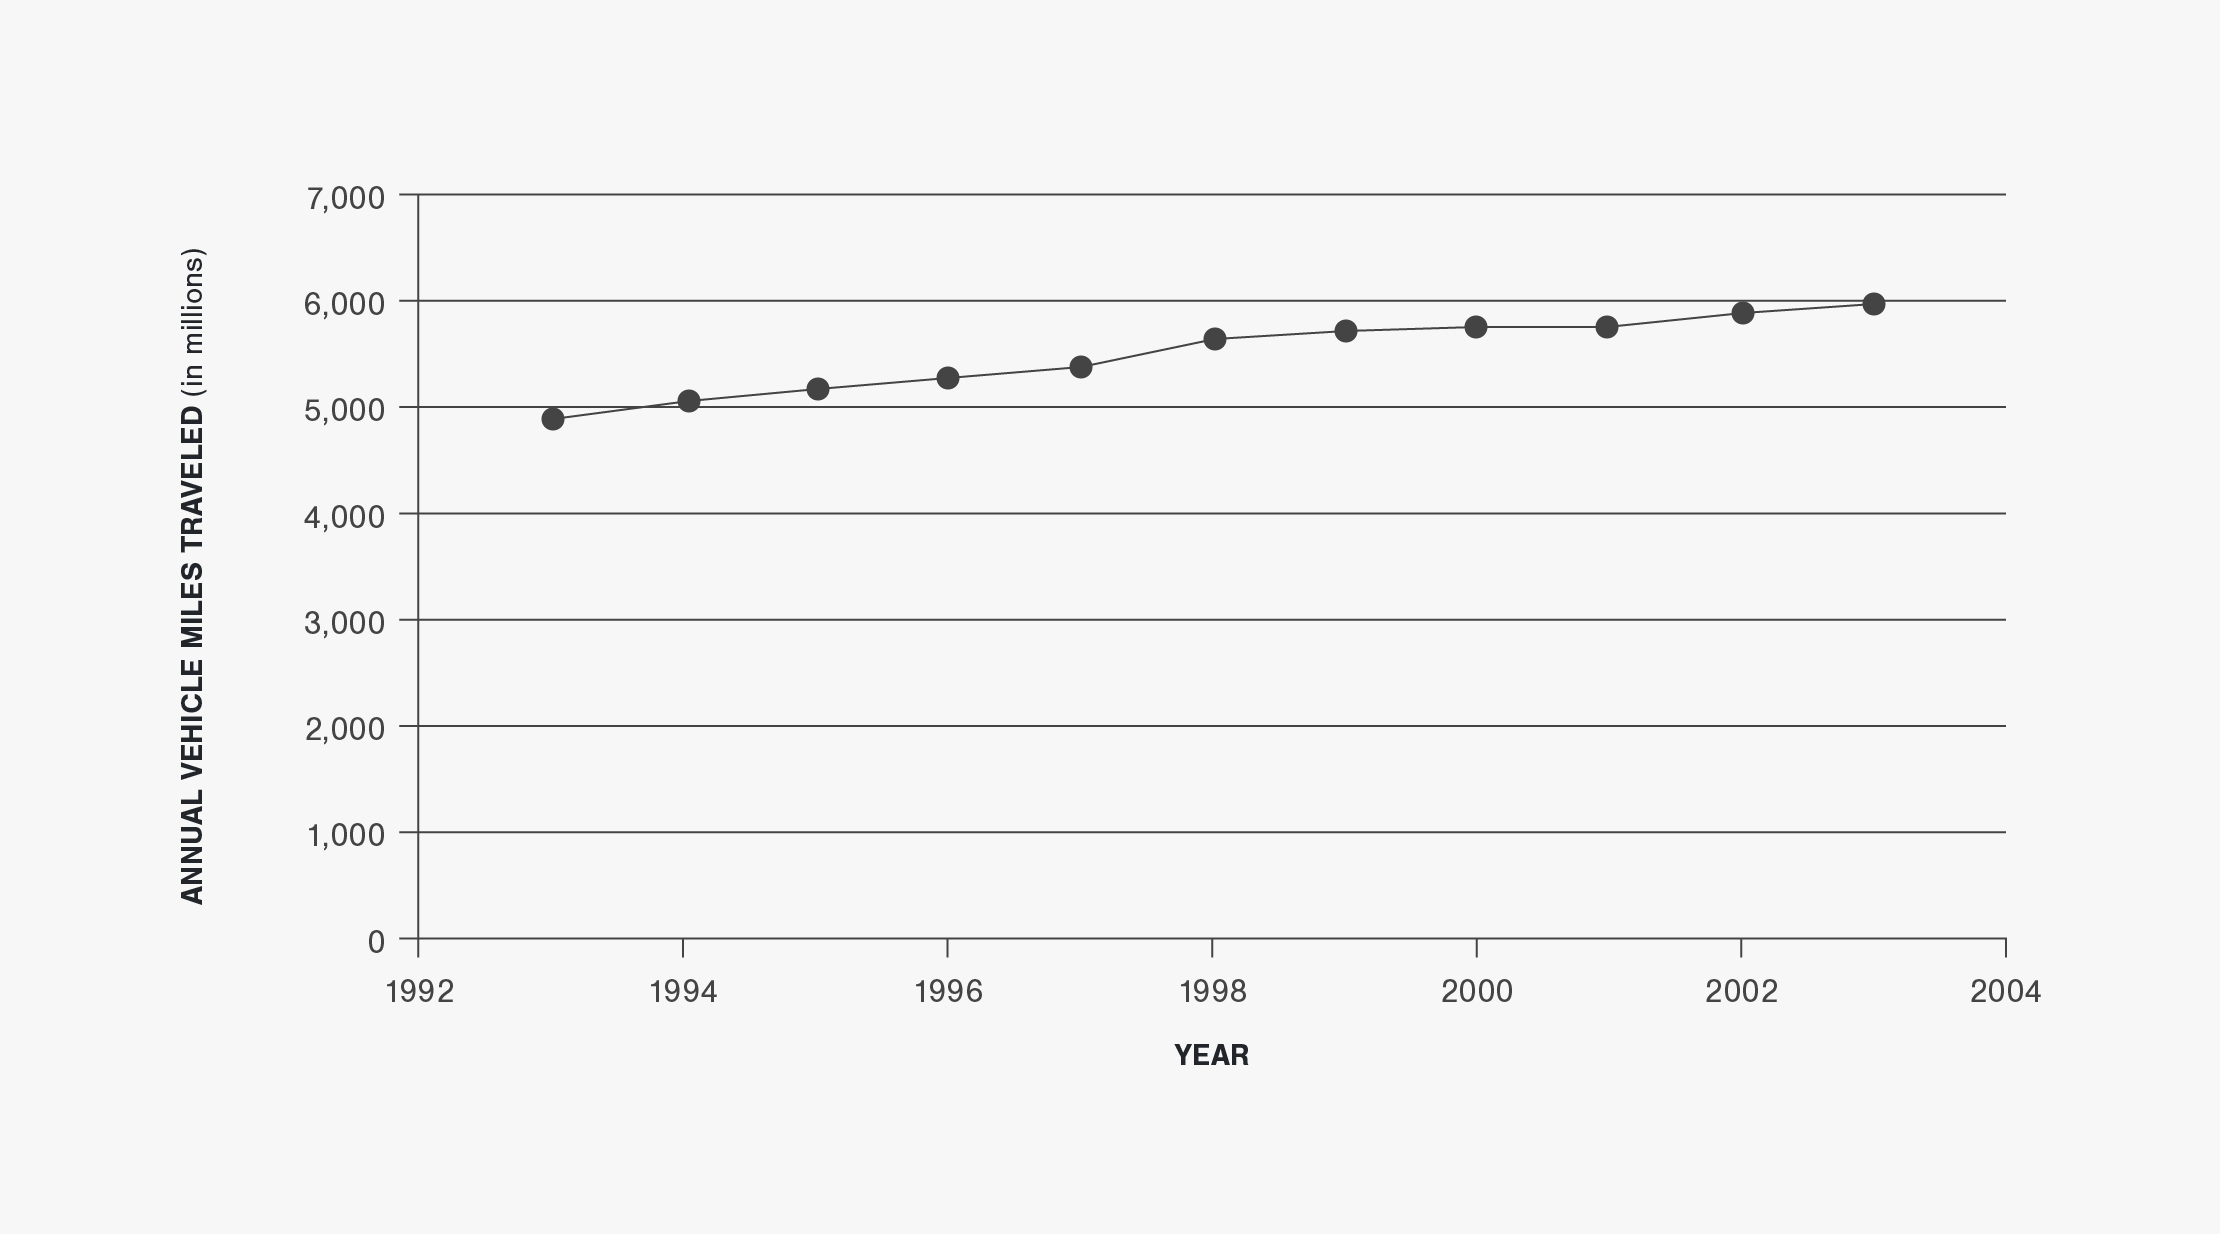
Figure 3 | Reported Deer-Vehicle Crashes in Wisconsin (1993 to 2003)
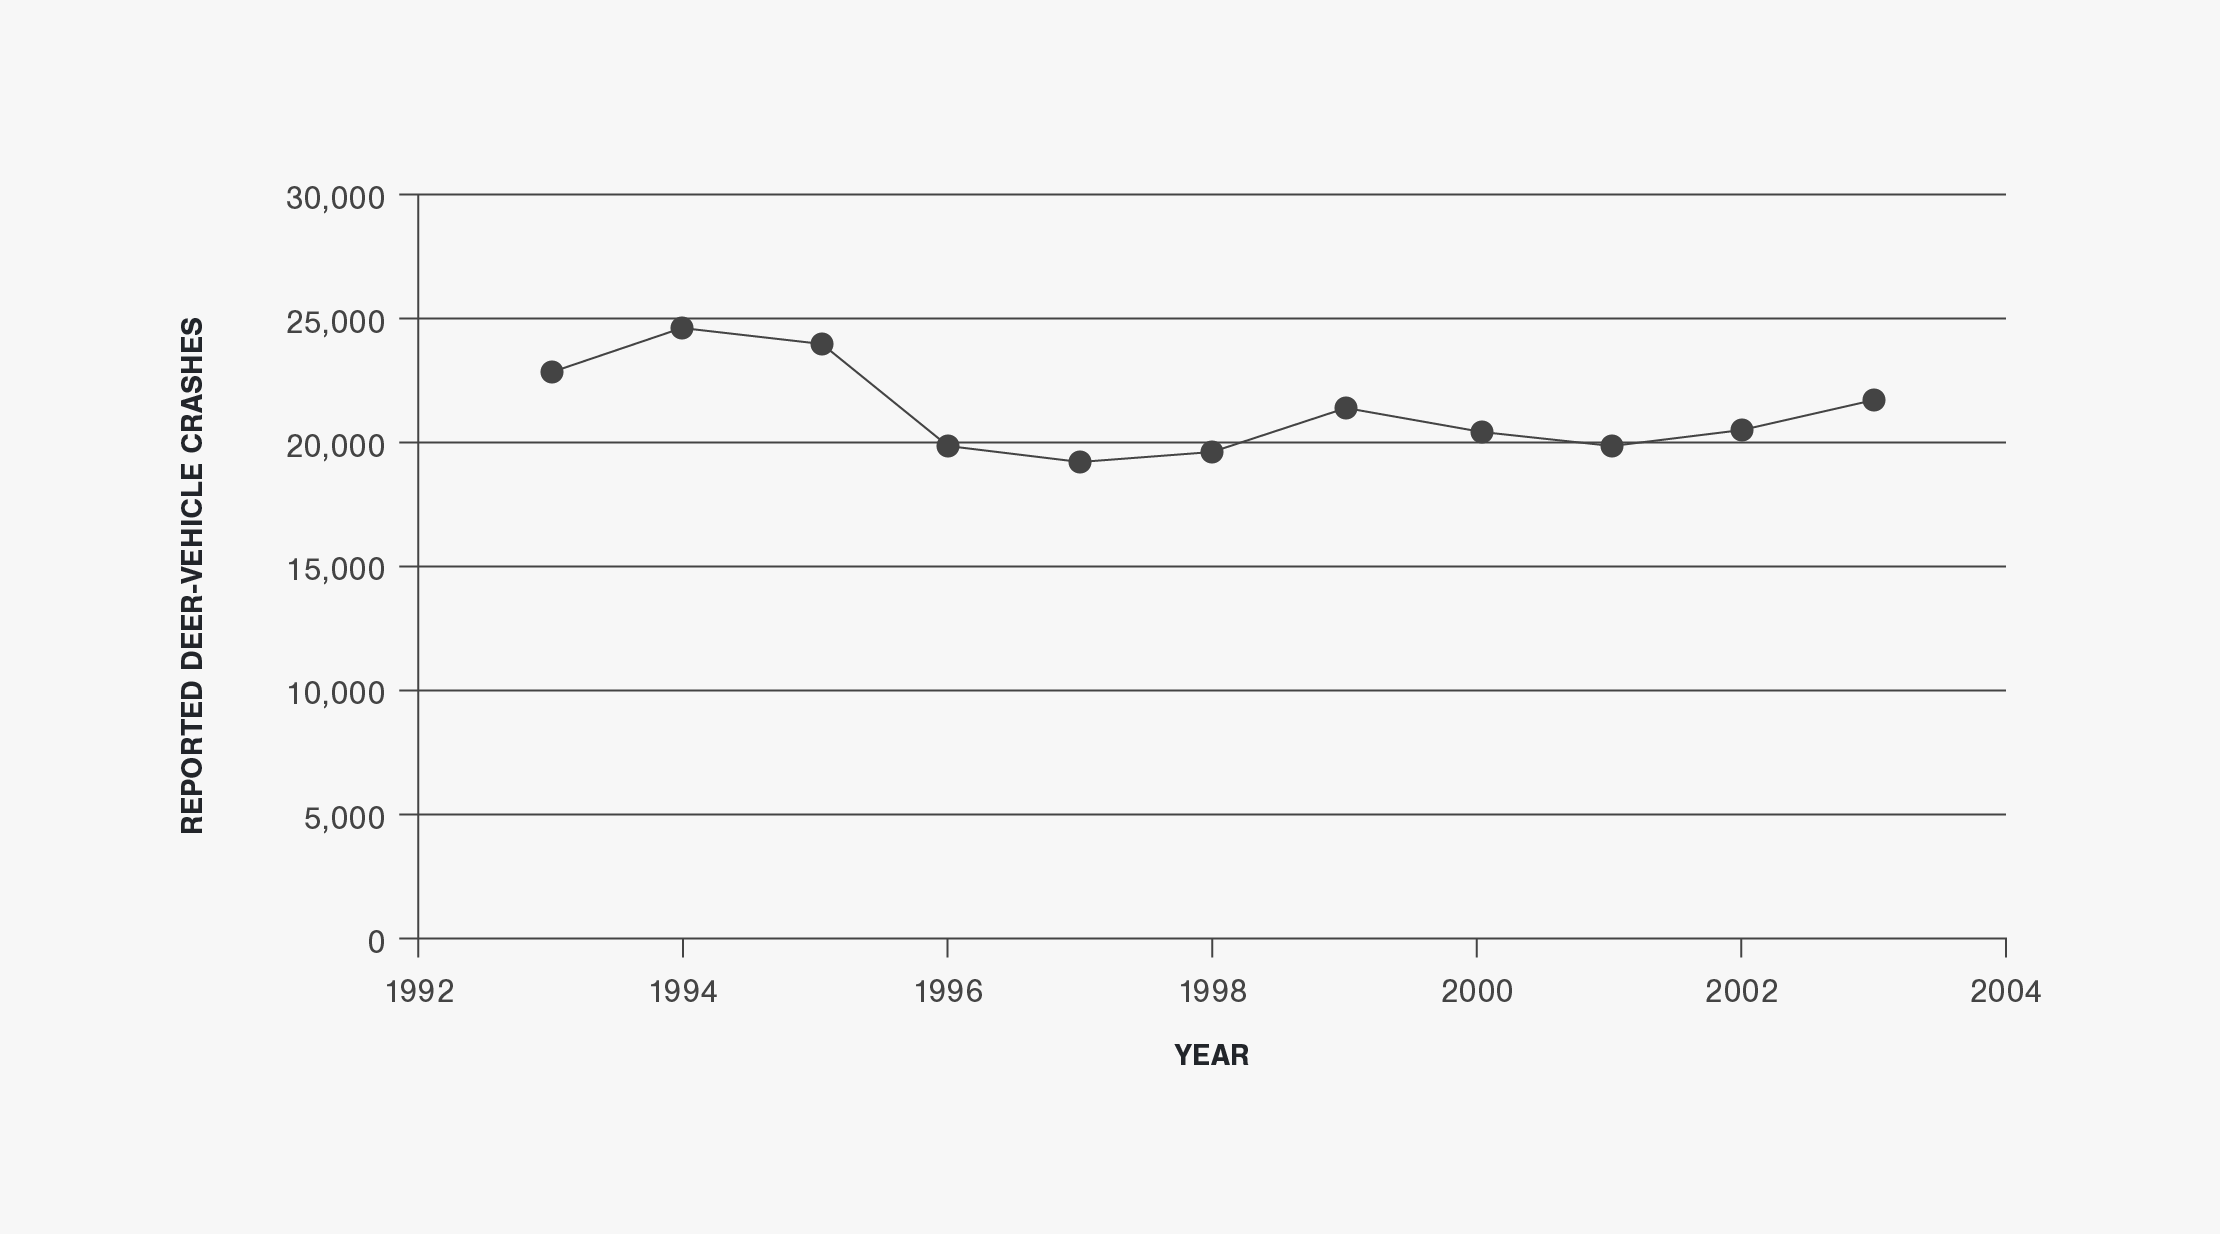
Figure 4 | Percent Deer-Vehicle Crashes in Wisconsin (1993 to 2003)
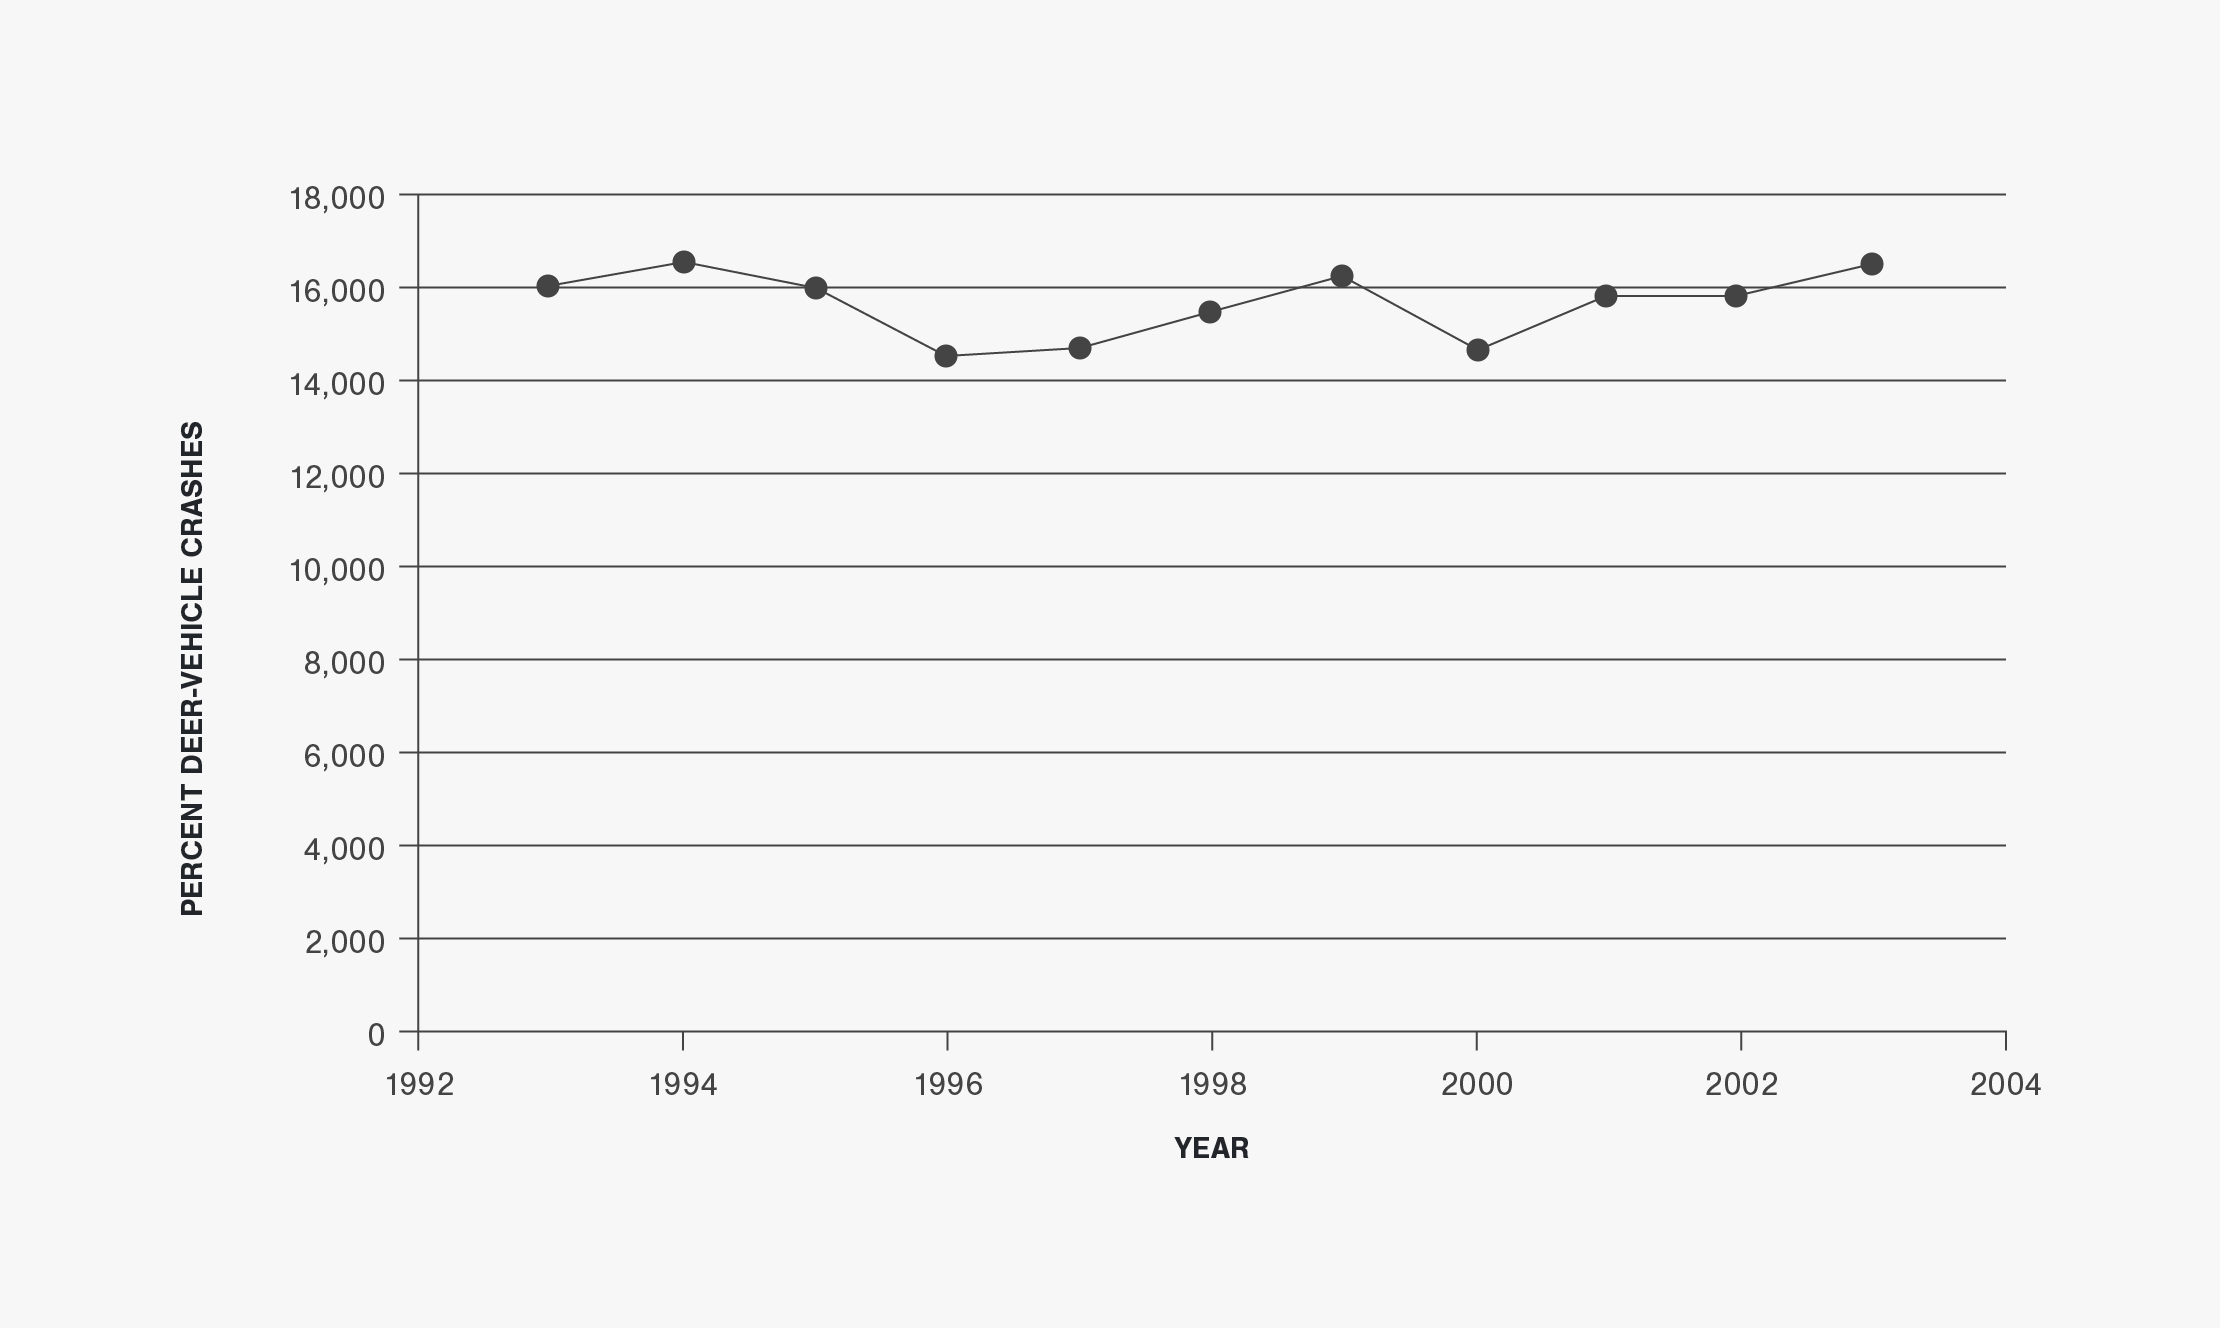
Figure 5 | Number of Deer-Vehicle Crash Fatalities and Injuries in Wisconsin (1993 to 2003)
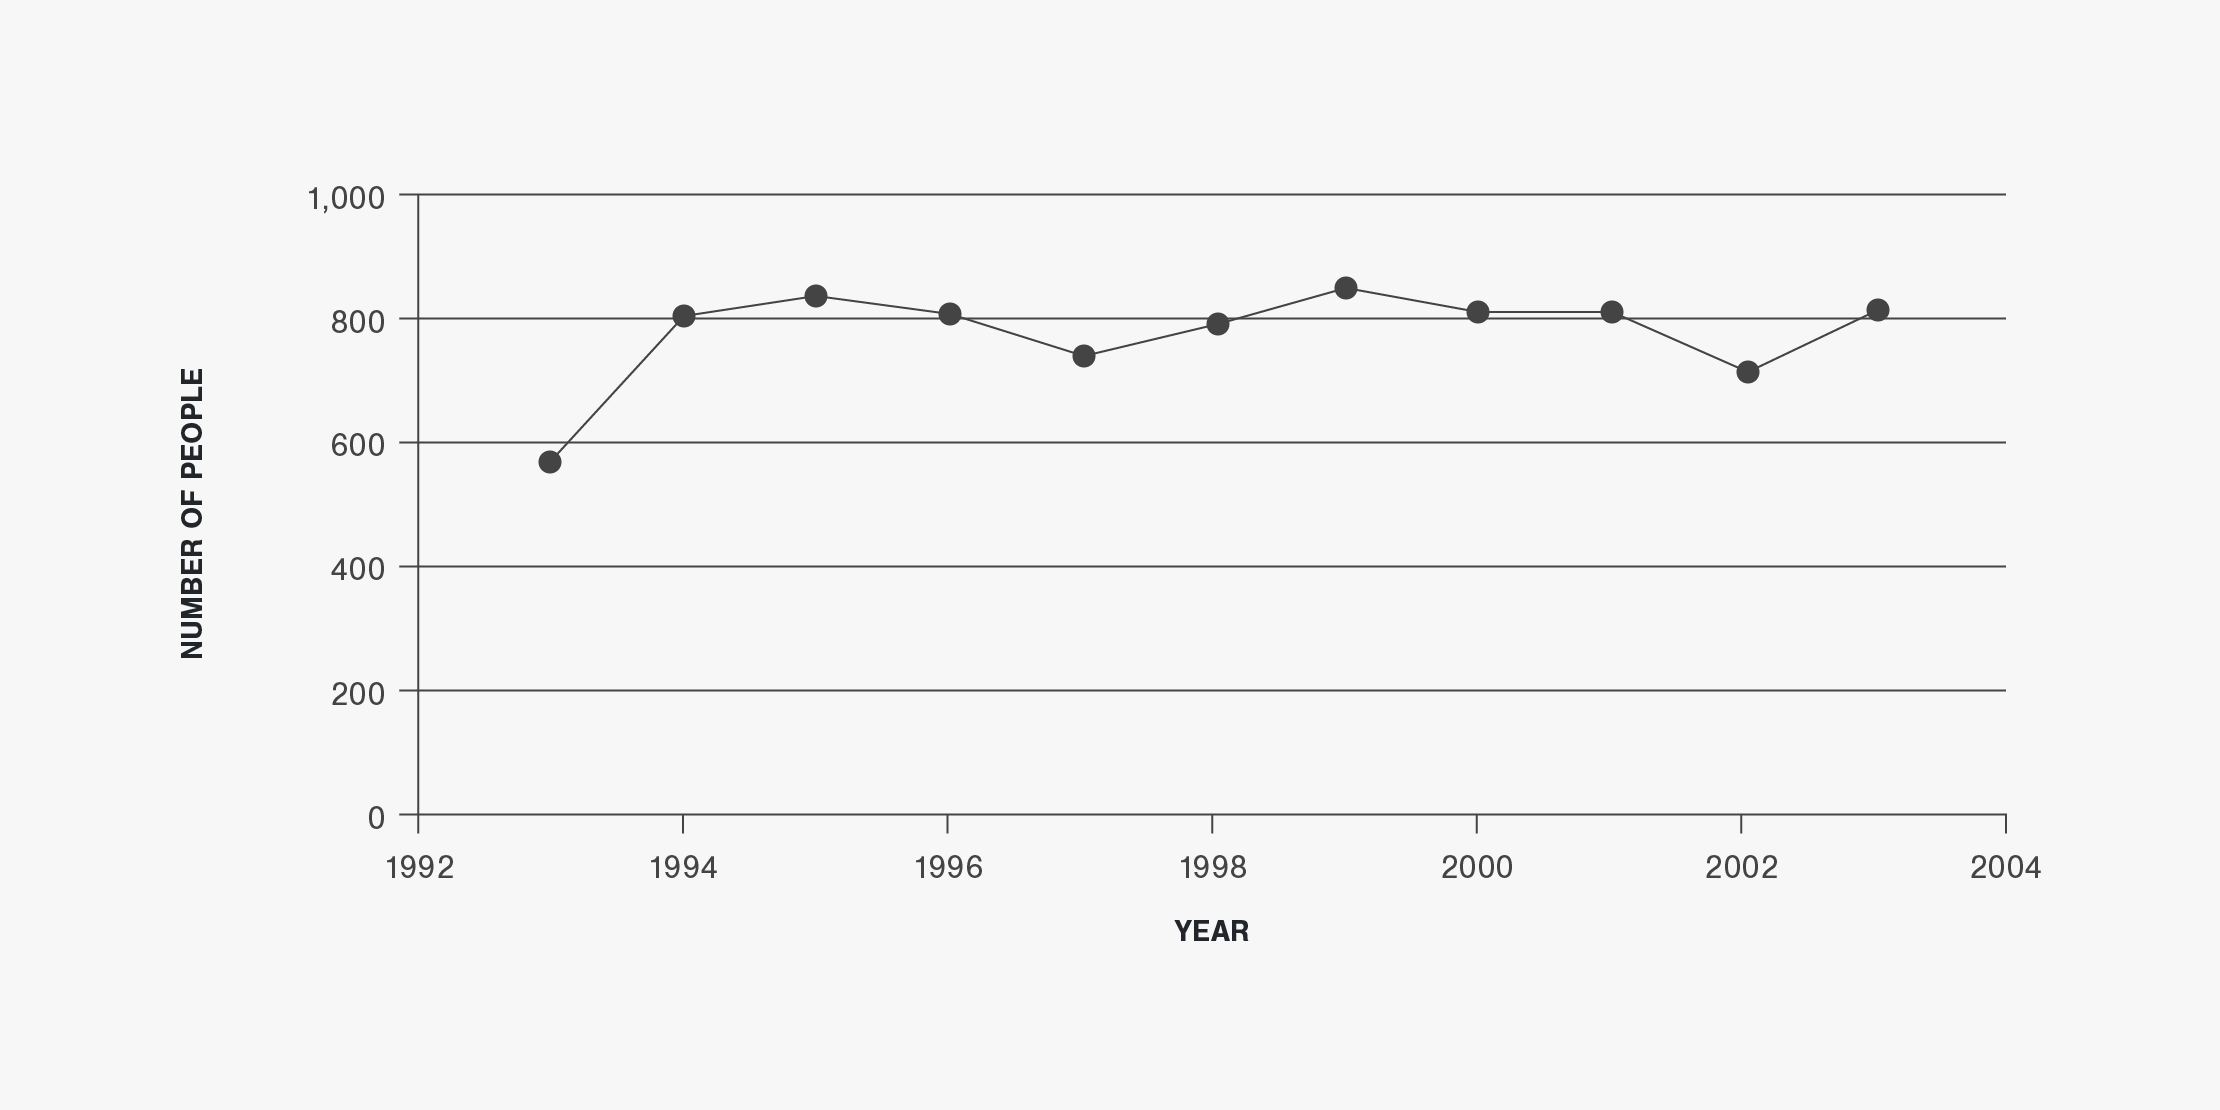
Figure 6 | Deer-Vehicle Crash Rate per 100 Million Vehicle-Miles-Traveled in Wisconsin (1993 to 2003)
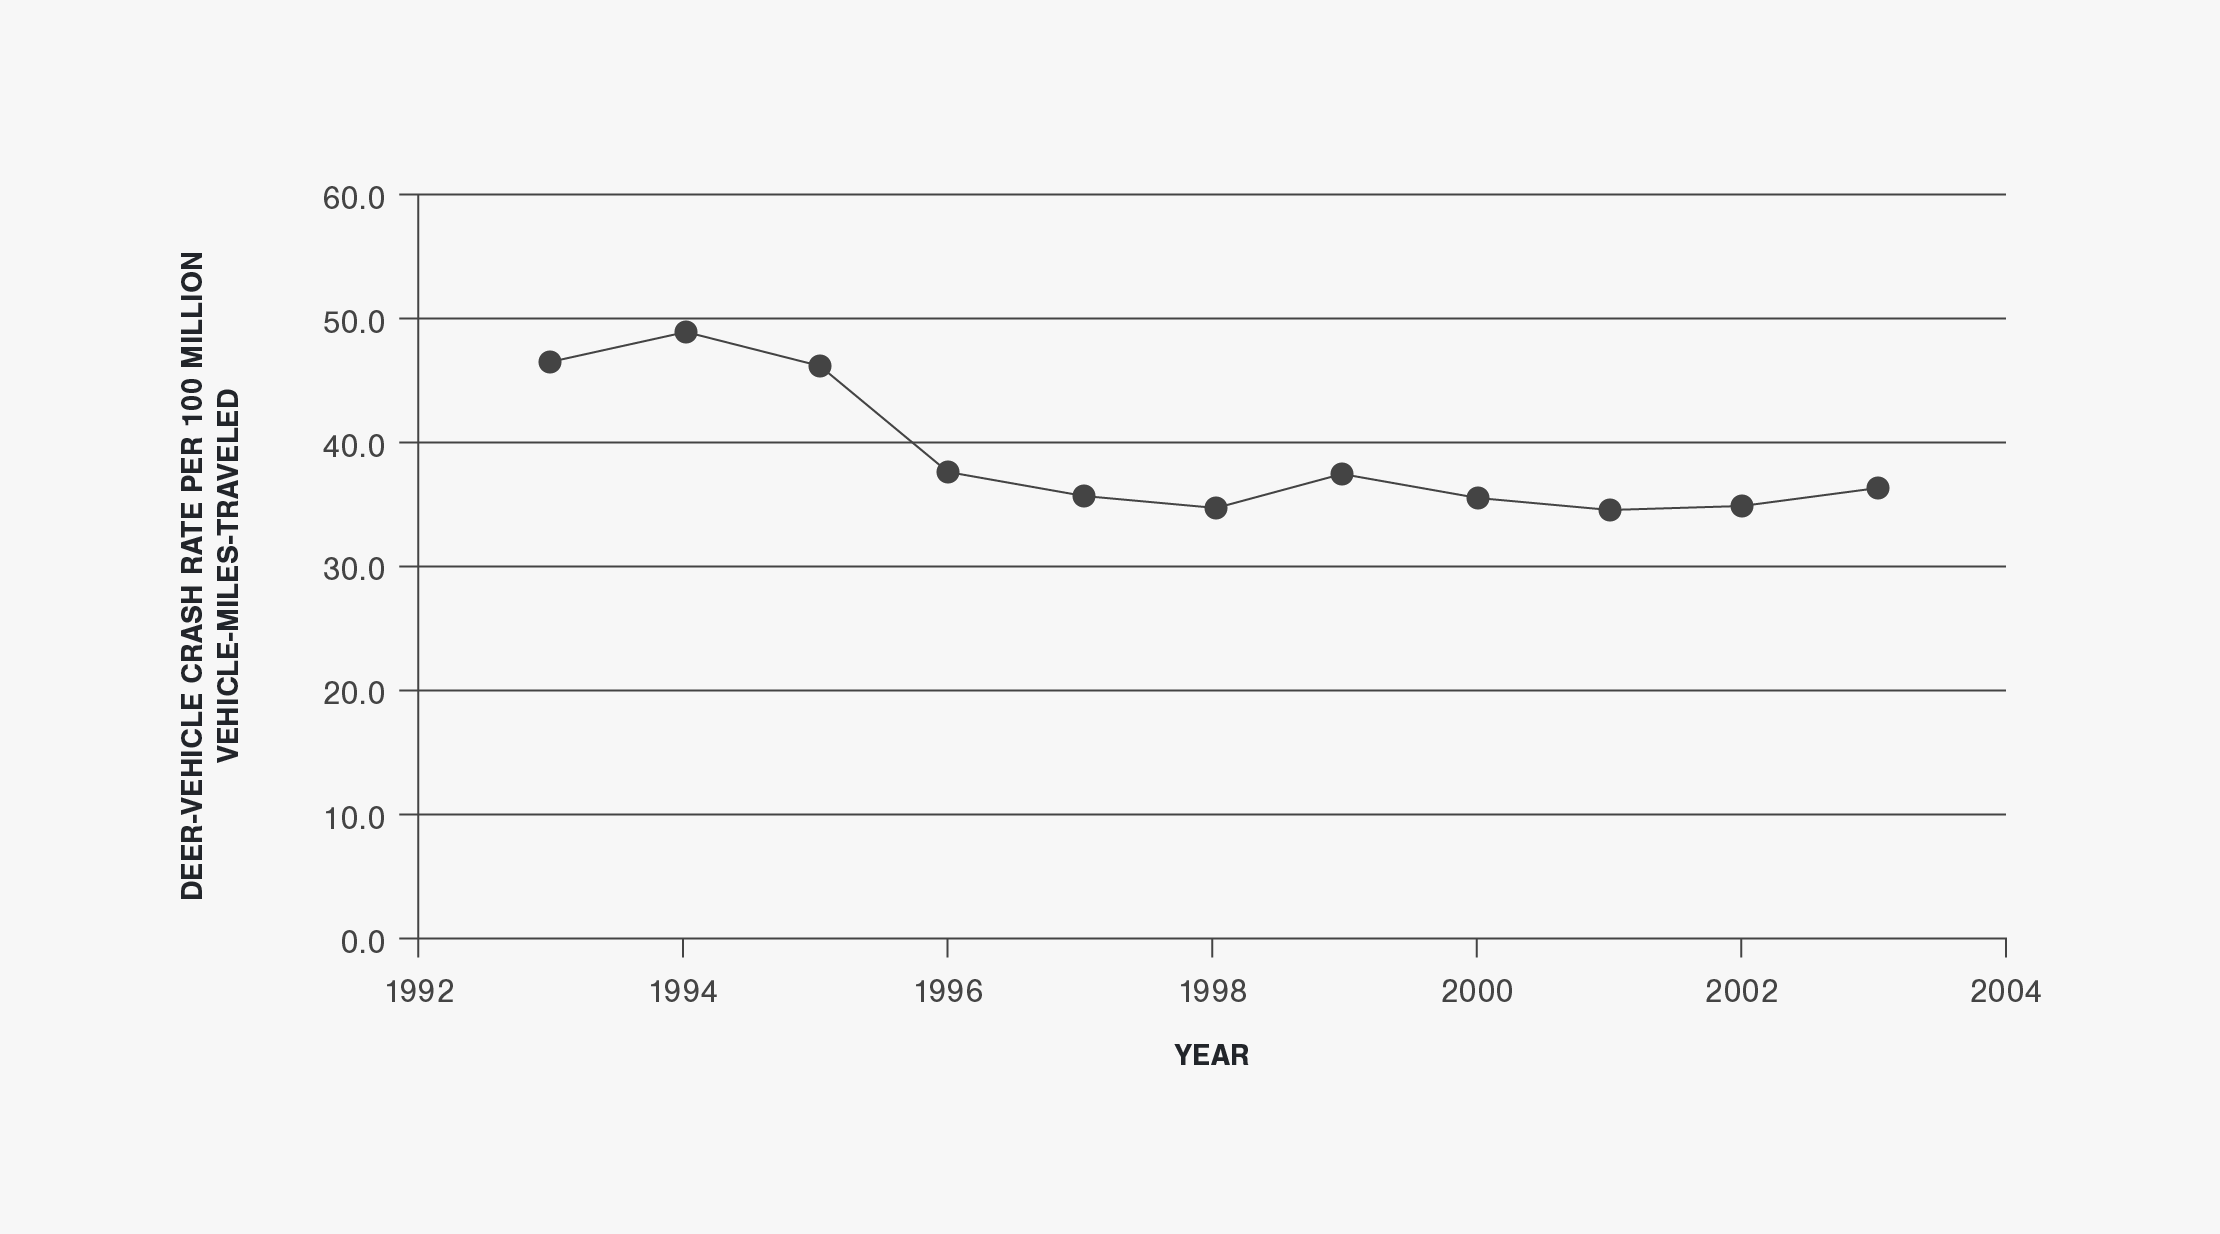
Figure 7 | Per-Hunt Deer Population Estimates and Deer-Vehicle Crashes in Wisconsin (1993 to 2003)
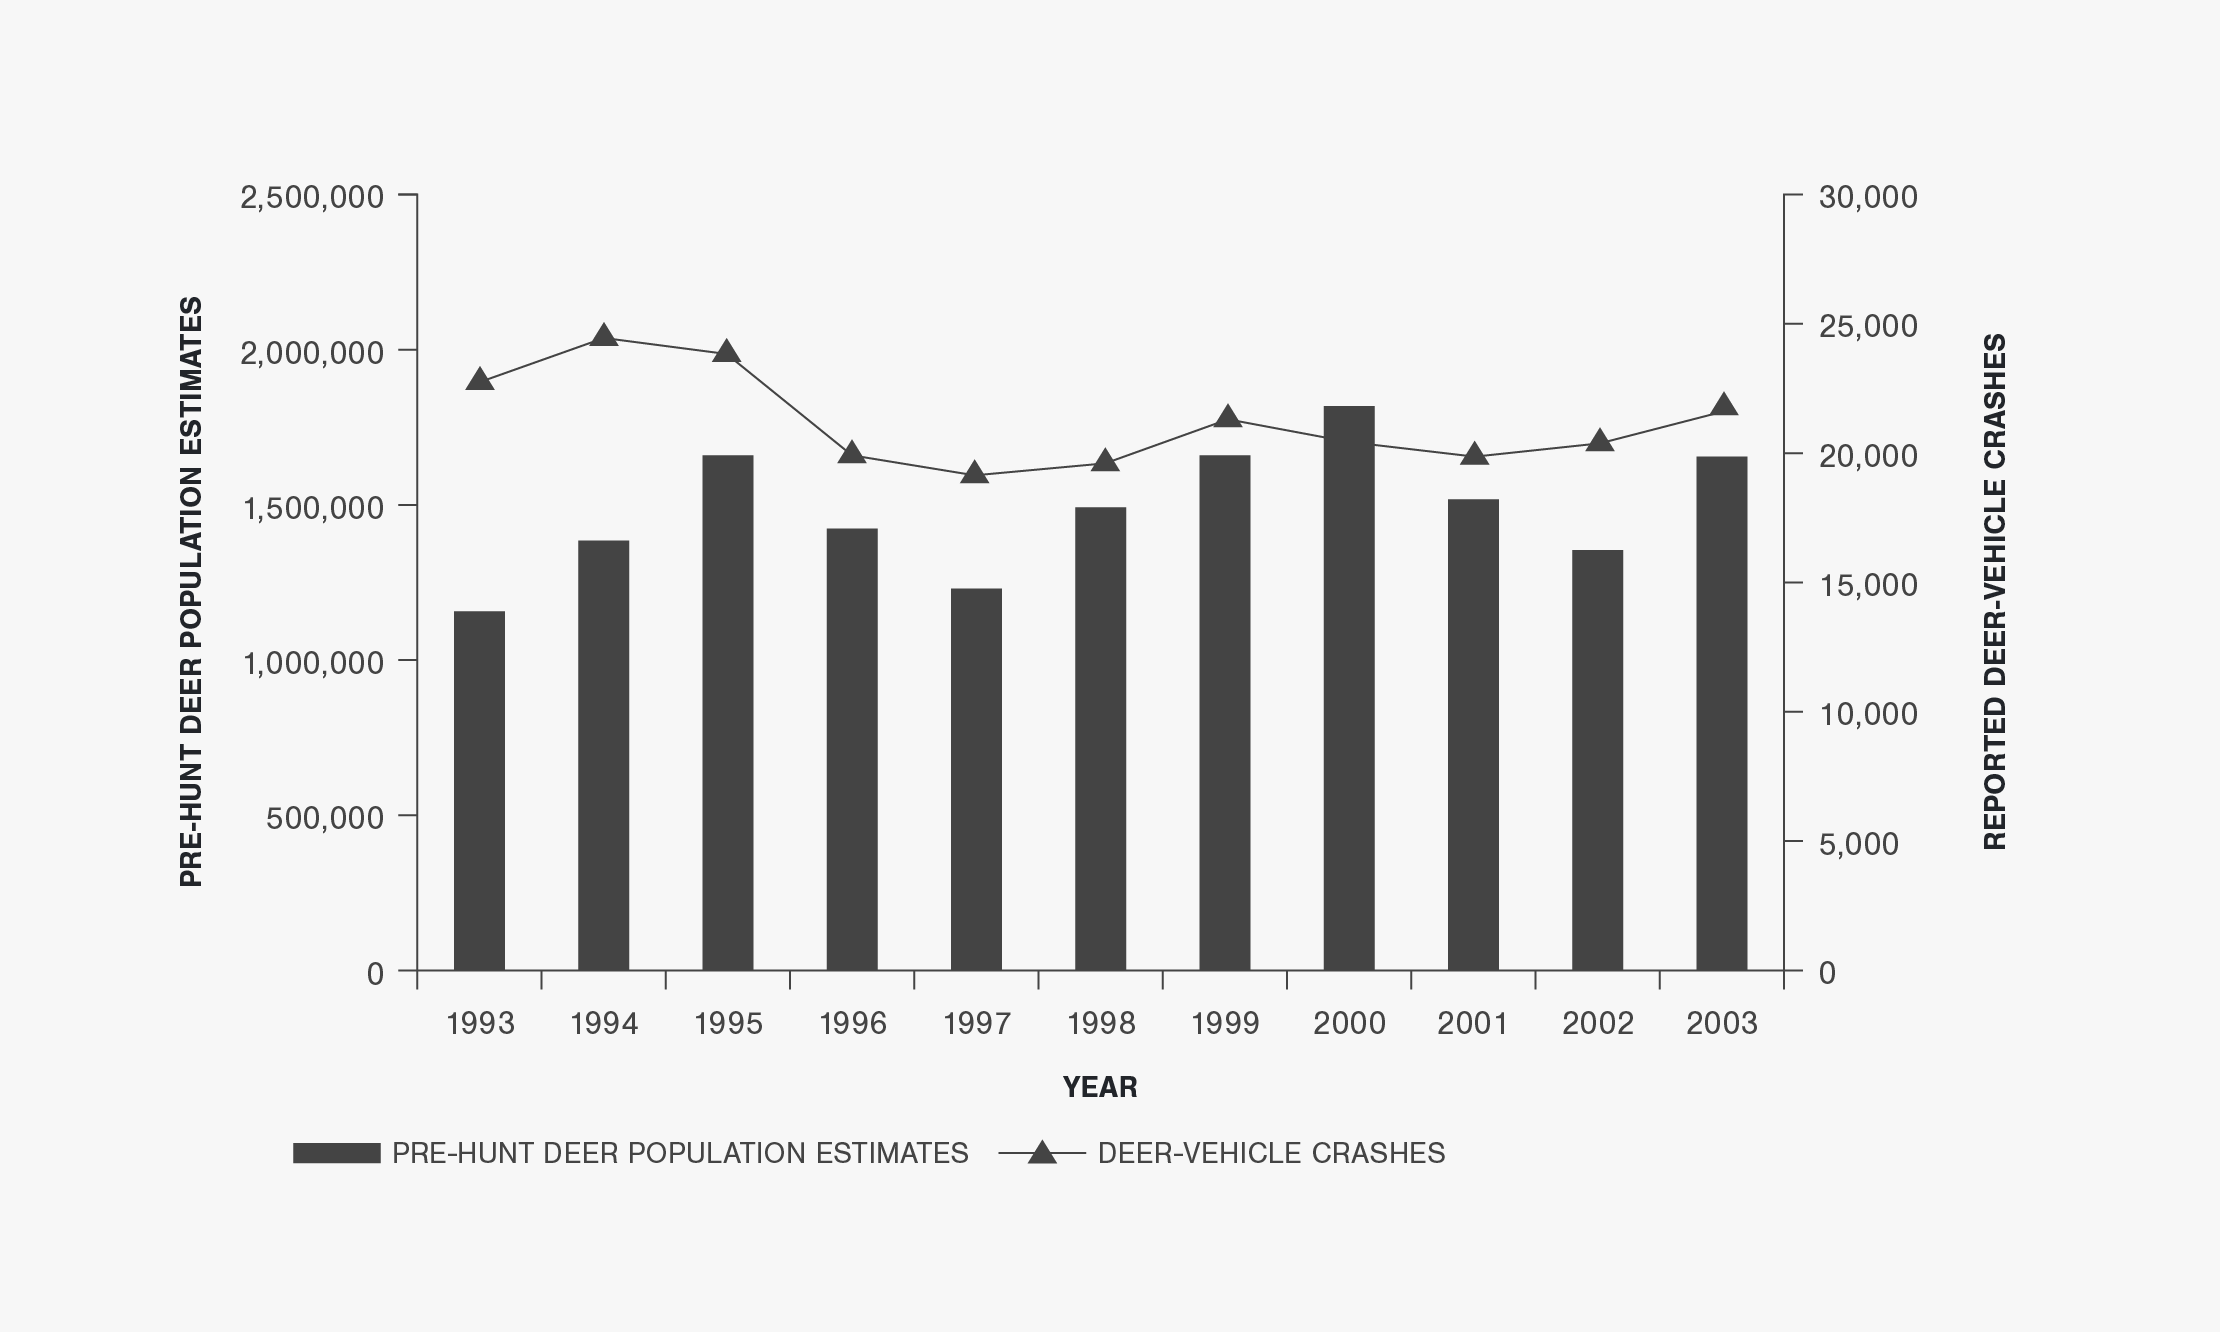
Figure 8 | Roadside Carcass Removals and Reported Deer-Vehicle Crashes in Wisconsin (1993 to 2003)
Wisconsin Data Table
Table A-5 | Wisconsin Deer-Vehicle Crash and Related Data (1993 to 2003)
a Minimum property damage reporting threshold changed from $500 to $1,000 on January 1, 1996..
Regional Data
10-Year Report: This report used only a portion of the data available from Upper Midwest Region. To view all Upper Midwest Region data, including the most recent data available, please visit the Multi-State Deer-Vehicle Crash General Data page.
Regional Data Summary
The 2002 (last year that data from all five states was available) DVC percentage (AVCs for Iowa) of all crashes reported in the Upper Midwest was approximately 10.7 percent. The annual total number of reported DVCs (AVCs for Iowa) has increased by about 17.3 percent in the Upper Midwest between 1993 and 2000. An evaluation of the DVC- or AVC-related data from Illinois, Iowa, Michigan, Minnesota, and Wisconsin showed the following general patterns:
- The annual total number of crashes reported and available for the Upper Midwest is shown in Figure 1 (See figure for the data that were not available). Overall, the annual number of crashes reported in the Upper Midwest has been generally stable when data for all five states were available (i.e., 1993 to 1995, 2000, and 2002). For these five years, the total annual number of crashes reported in the region ranged from 1,099,343 in 1993 to 1,204,208 in 1995 (with a similar number of crashes reported in 2000). The average annual total number of crashes reported from 1993 to 1995, 2000, and 2002 was 1,157,465. The AVMT in Upper Midwest has consistently increased during the study time period (See Figure 2).
- Overall, the annual number of reported DVCs (AVCs in Iowa) increased quite quickly from 1993 to 1995 and then continued to increase at a slower rate from 1995 to 2003. An increase of 16.6 percent occurred between 1993 and 1995, and a further increase of 5.2 percent happened between 1995 and 2003. Overall, there has been a 22.7 percent increase in the annual number of DVCs reported in the Upper Midwest between 1993 and 2003.
- The percentage of total crashes represented by DVCs also increased from 9.2 percent in 1993 to 10.9 percent in 2002 (the last year with data from all five states available). It should be noted, however, that this regional percentage increased dramatically (See Figure 4) when the non-fatal crashes from the city of Chicago were not available (e.g., 1996 to 1999) for this calculation. Excluding 1996, due to questions about the DVC data provided by Illinois, the average DVC/AVC percentage for the region was about 13.7 percent for this time period.
- The annual number of fatalities in the Upper Midwest due to DVCs ranged from 12 to 45 between 1993 and 2003.The number of injuries and fatalities due to DVCs increased from 3,900 in 1993 to 5,342 in 1999 (an increase of 37 percent), but then decreased to 4,981 in 2002. A total of 51,609 DVC injuries were reported during the eight years for which this data was used or available (although there were also two additional years when non-fatal crashes from the City of Chicago were not available).
- The Upper Midwest DVC rate (i.e., the number of DVCs per HMVMT) was relatively stable from 1993 to 2003 (See Figure 43). The variability that does appear in Figure 43 is primarily due to the inability to use the crash data from at least one state in 1996, 2001, and 2003. The largest DVC rate in the Upper Midwest, when the crashes from all five states were used, was 38.8 DVCs per HMVMT in 1995, and the smallest was 34.8 per HMVMT in 2002. The average annual DVC rate for all five states from 1993 to 2003 was 36.1 DVCs per HMVMT.
- Four states in the Upper Midwest provided annual deer population estimates for most of the 1993 to 2003 time period. Three states also provided deer carcass removal numbers. For comparison purposes, the annual deer population estimates shown in Figure 44 are only for those in which DVC data were also available (this excludes 1993, 2001, and 2003). The Upper Midwest annual deer population estimates shown in Figure 7 generally follow a cyclical pattern (a similar pattern is also followed when the deer population estimates of all four states are plotted, but with a relatively stable annual estimate past 2000). From 1994 to 1995 there was an increase in the estimated deer population and from 1995 to 1997 there was a decrease. The minimum deer population estimate, when data from all four states were used, was 4,029,682 deer in 1997. The deer population estimate increased from 4,029,682 deer in 1997 to a maximum of 5,107,837 deer in 2000. The number of carcasses removed from the roadside, on the other hand, generally increased from 61,429 in 1993 to 69,148 in 1996 (a 12.6 percent increase) and then stabilized from 1996 to 2000 (averaging 68,015). The number of carcasses removed ranged from about 170 to 210 percent of the DVCs reported between 1993 and 2003 (when data from all three states were used). The average of this measure was about 200 percent.
Figures
Figure 1 | Total Crashes Reported in the Upper Midwest (1993 to 2003)
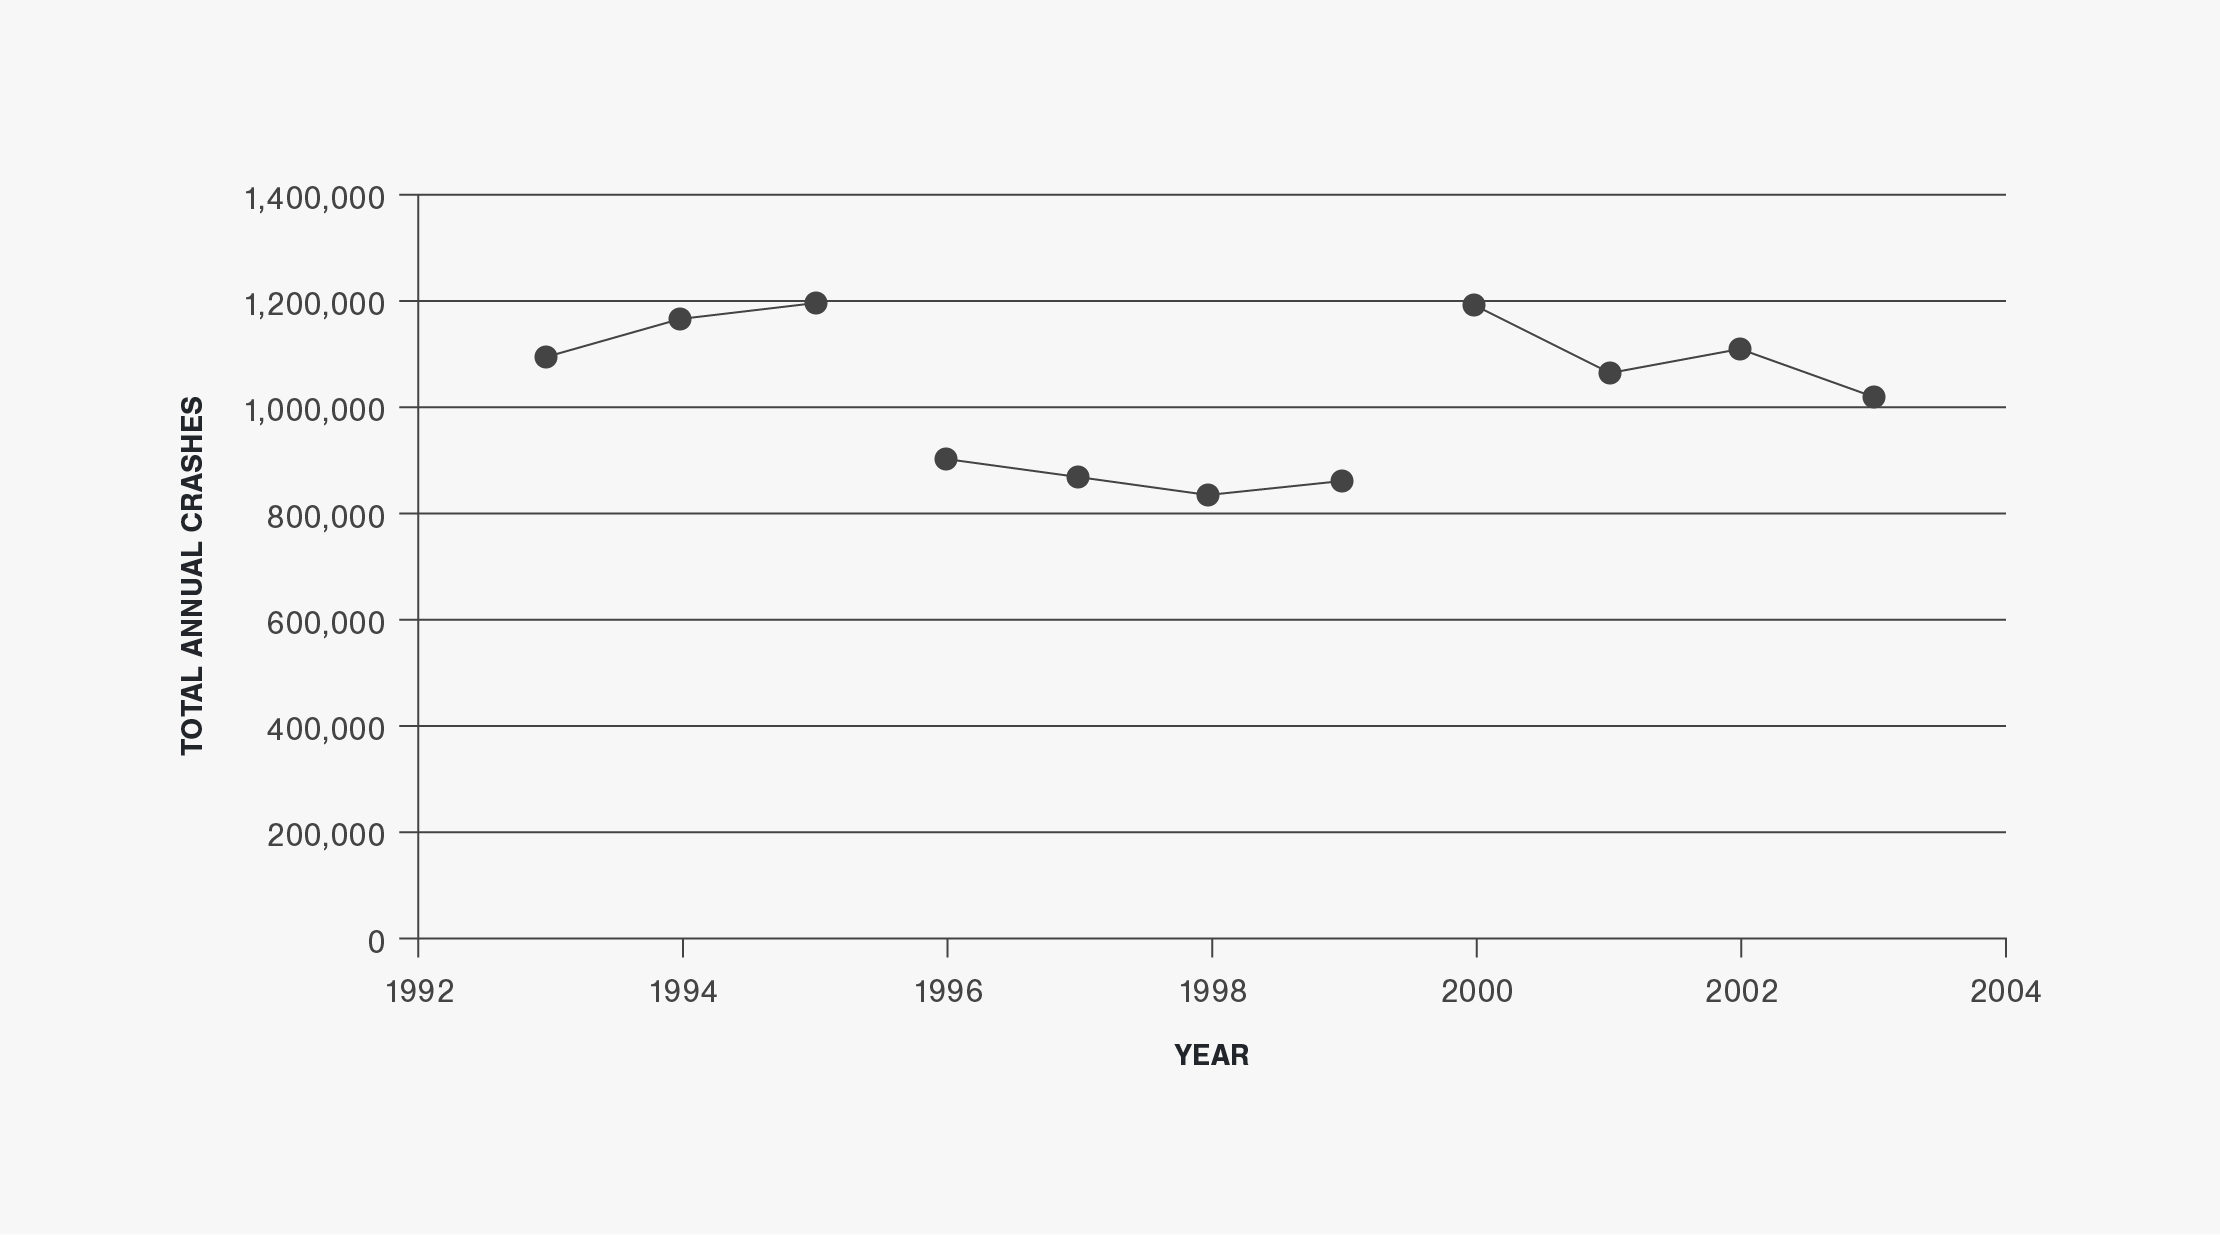
Figure 2 | Annual Vehicle-Miles-Traveled in the Upper Midwest (1993 to 2003)
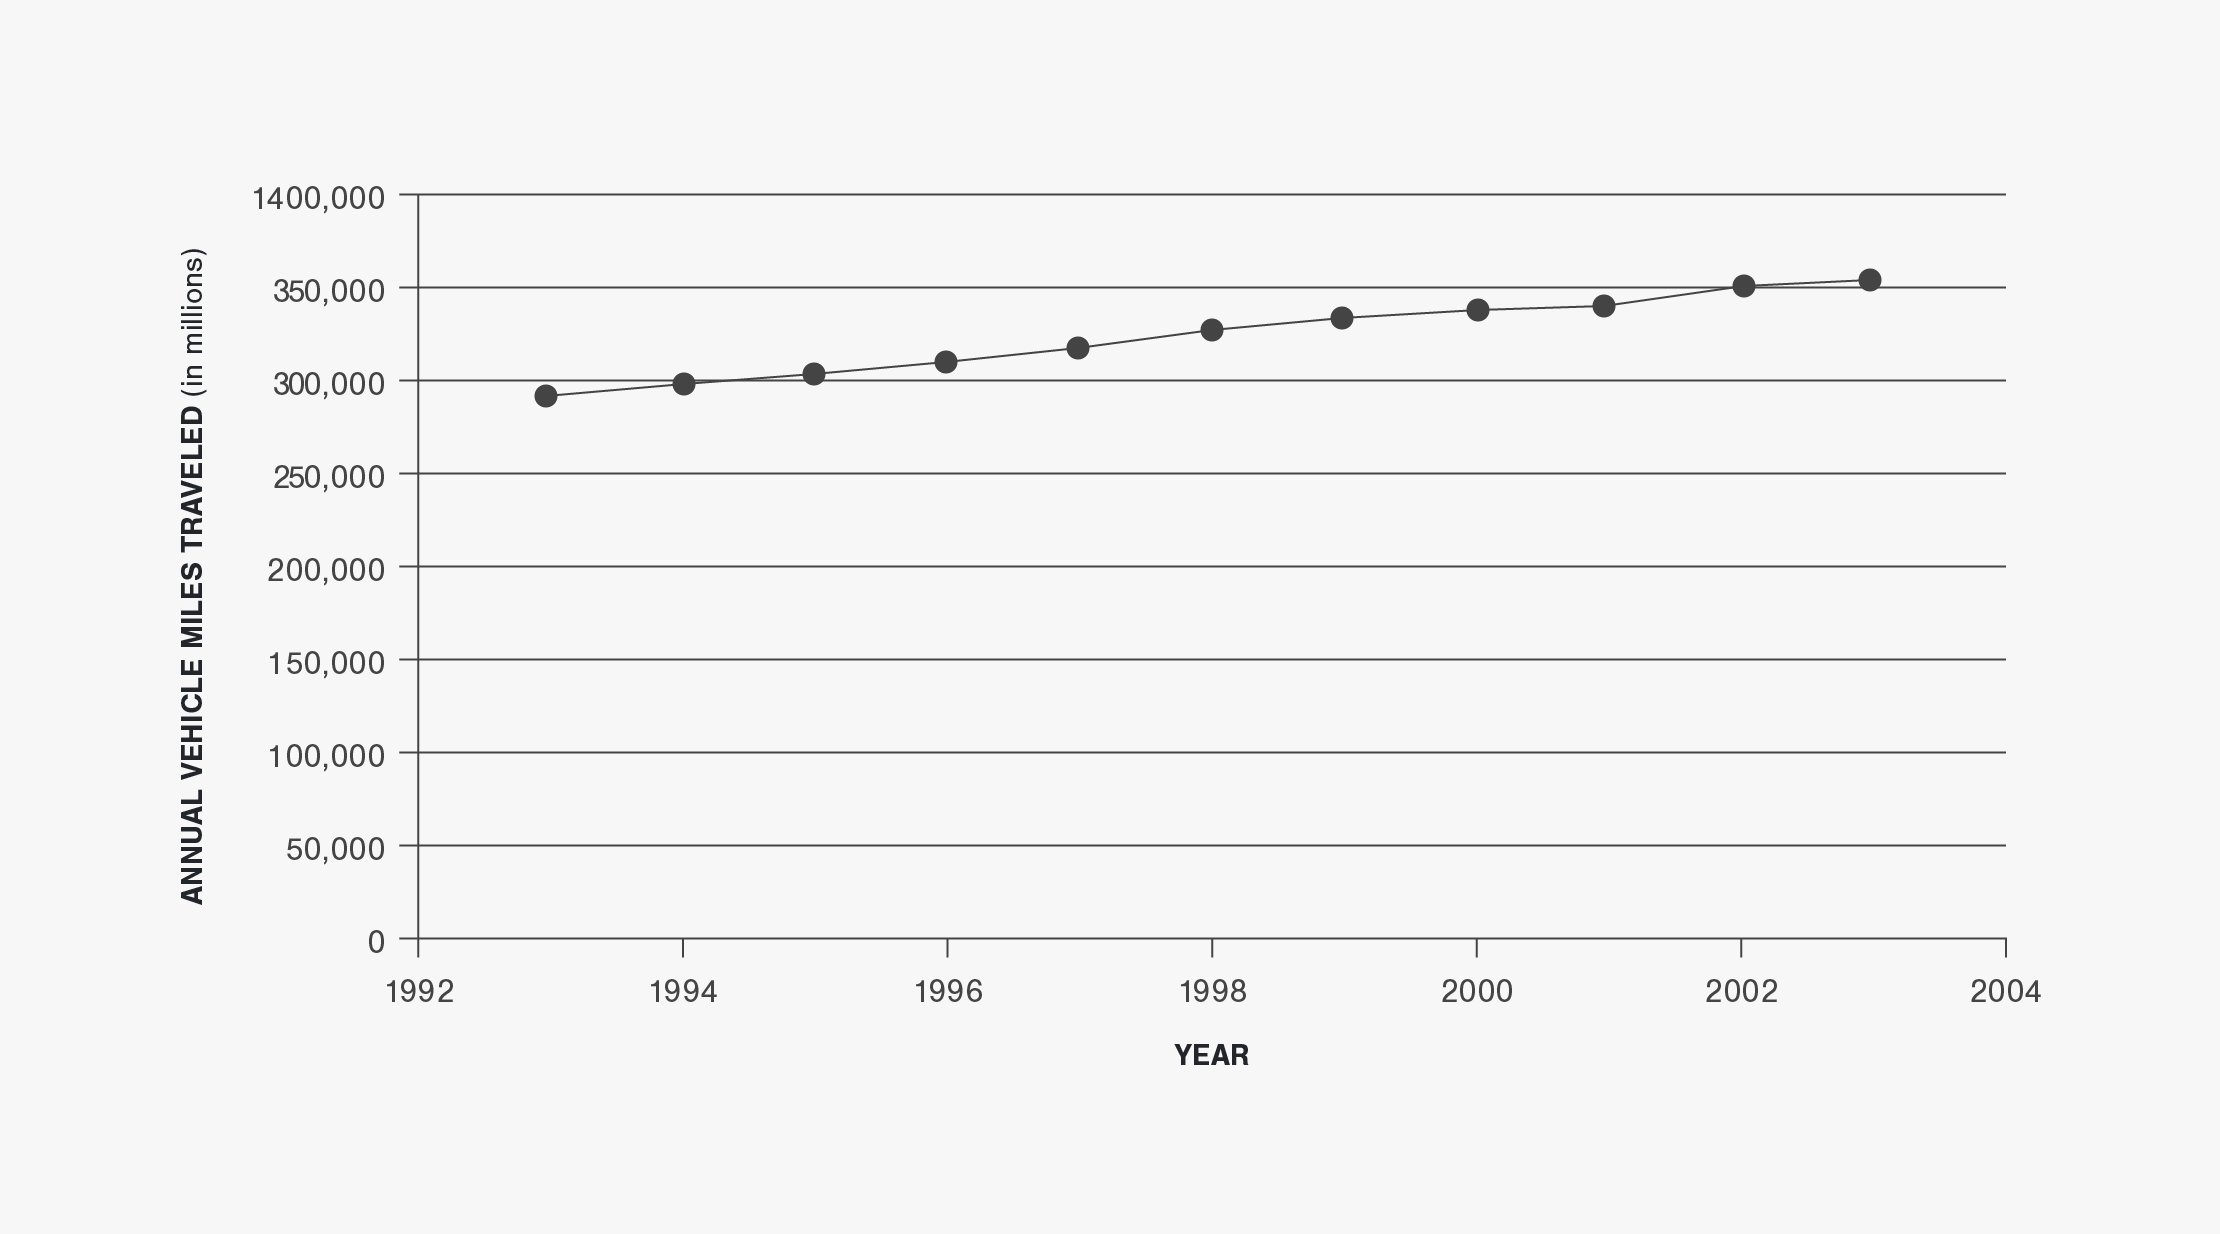
Figure 3 | Reported Deer-Vehicle Crashes in the Upper Midwest (1993 to 2003)
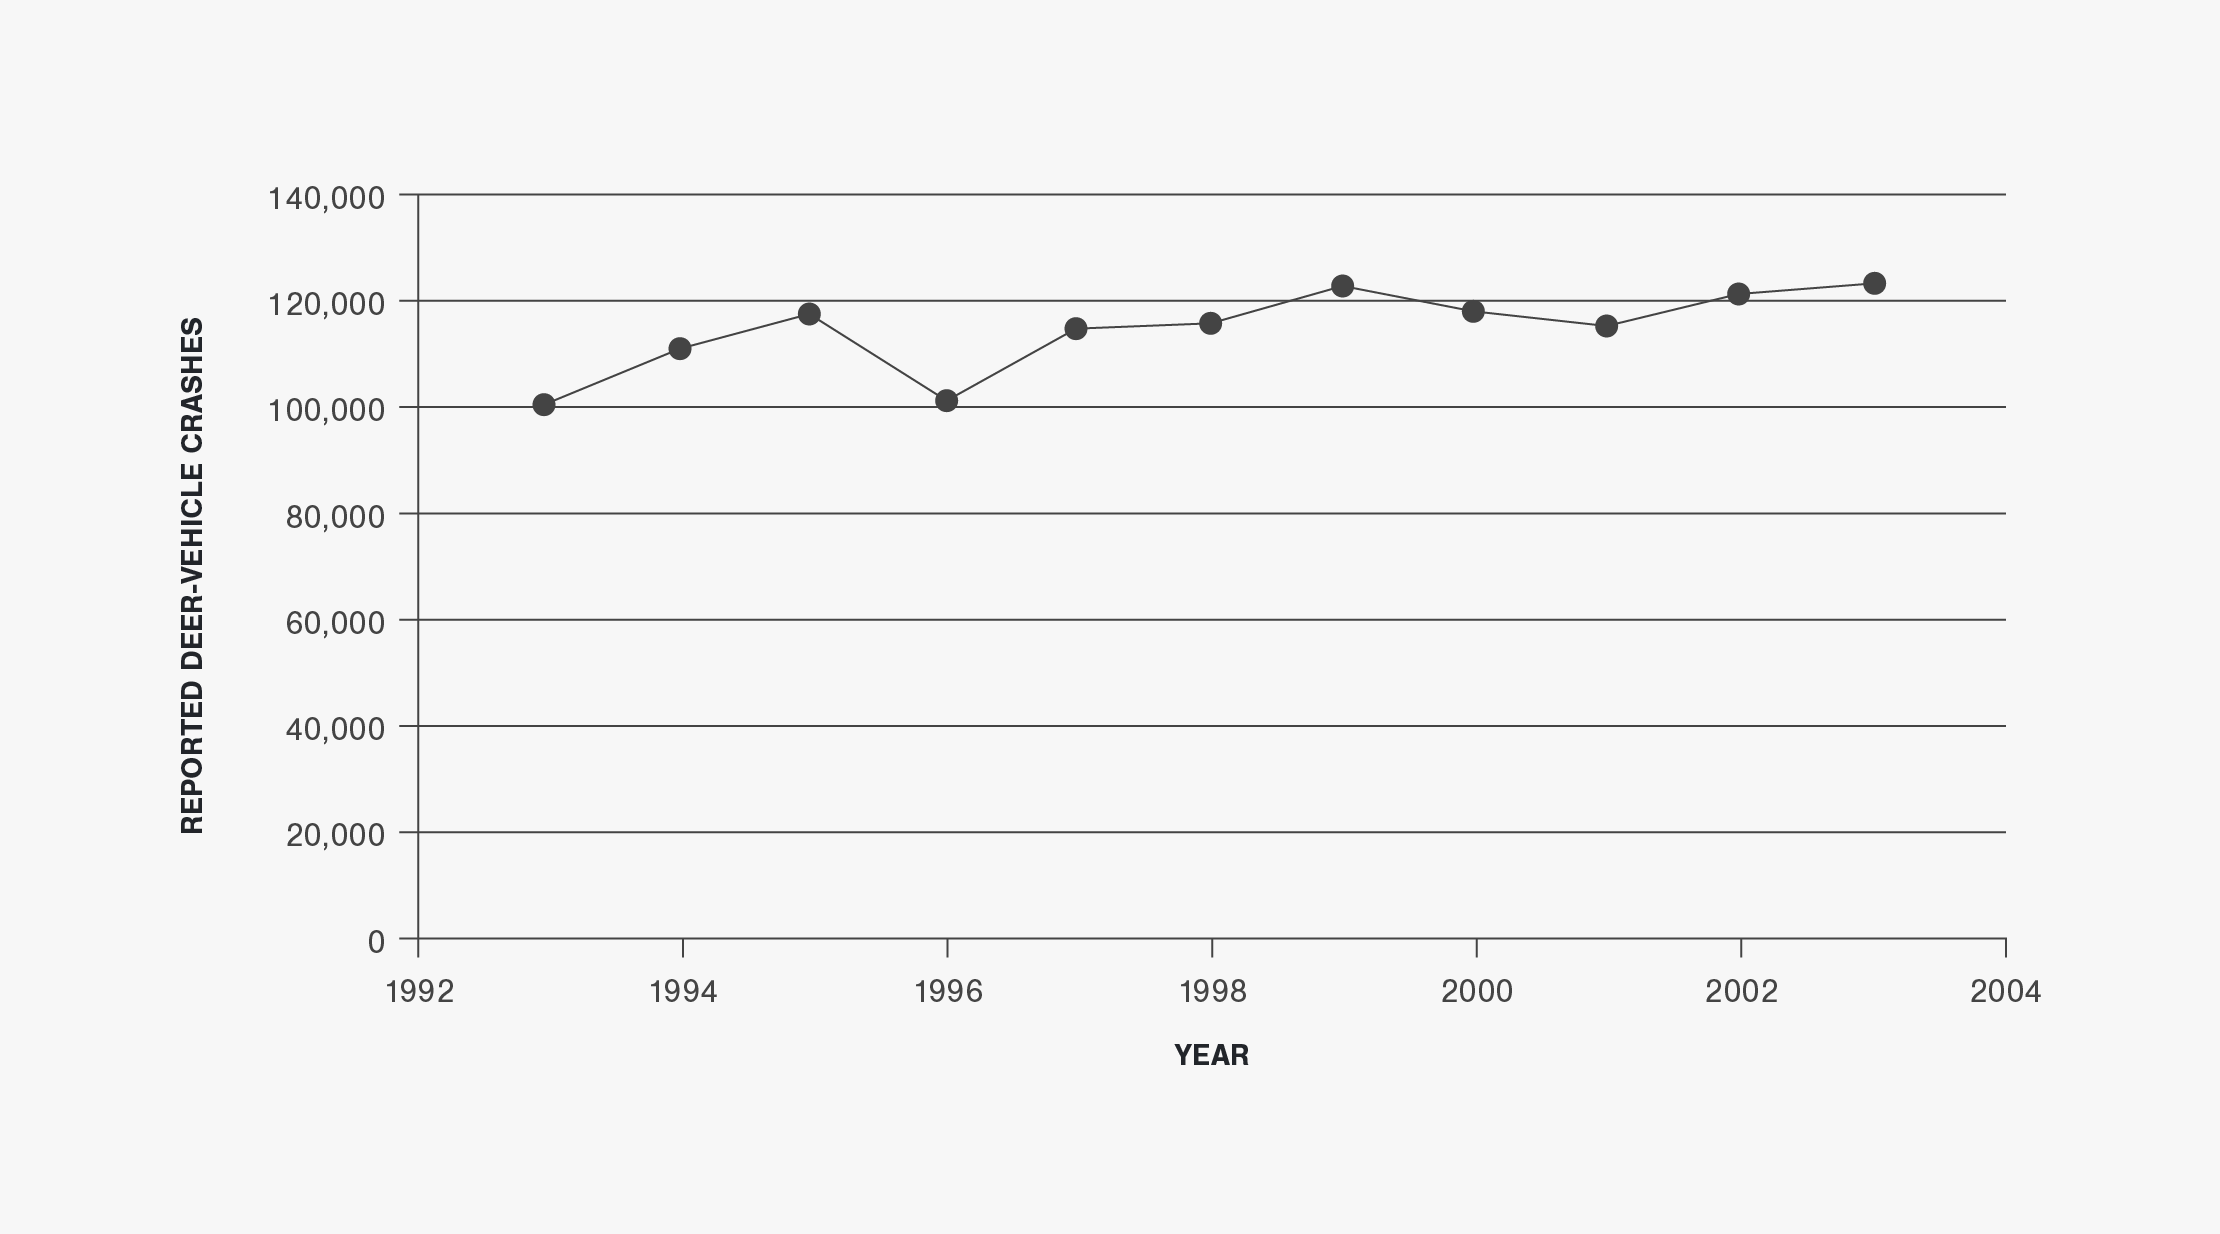
Figure 4 | Percent Deer-Vehicle Crashes in the Upper Midwest (1993 to 2003)
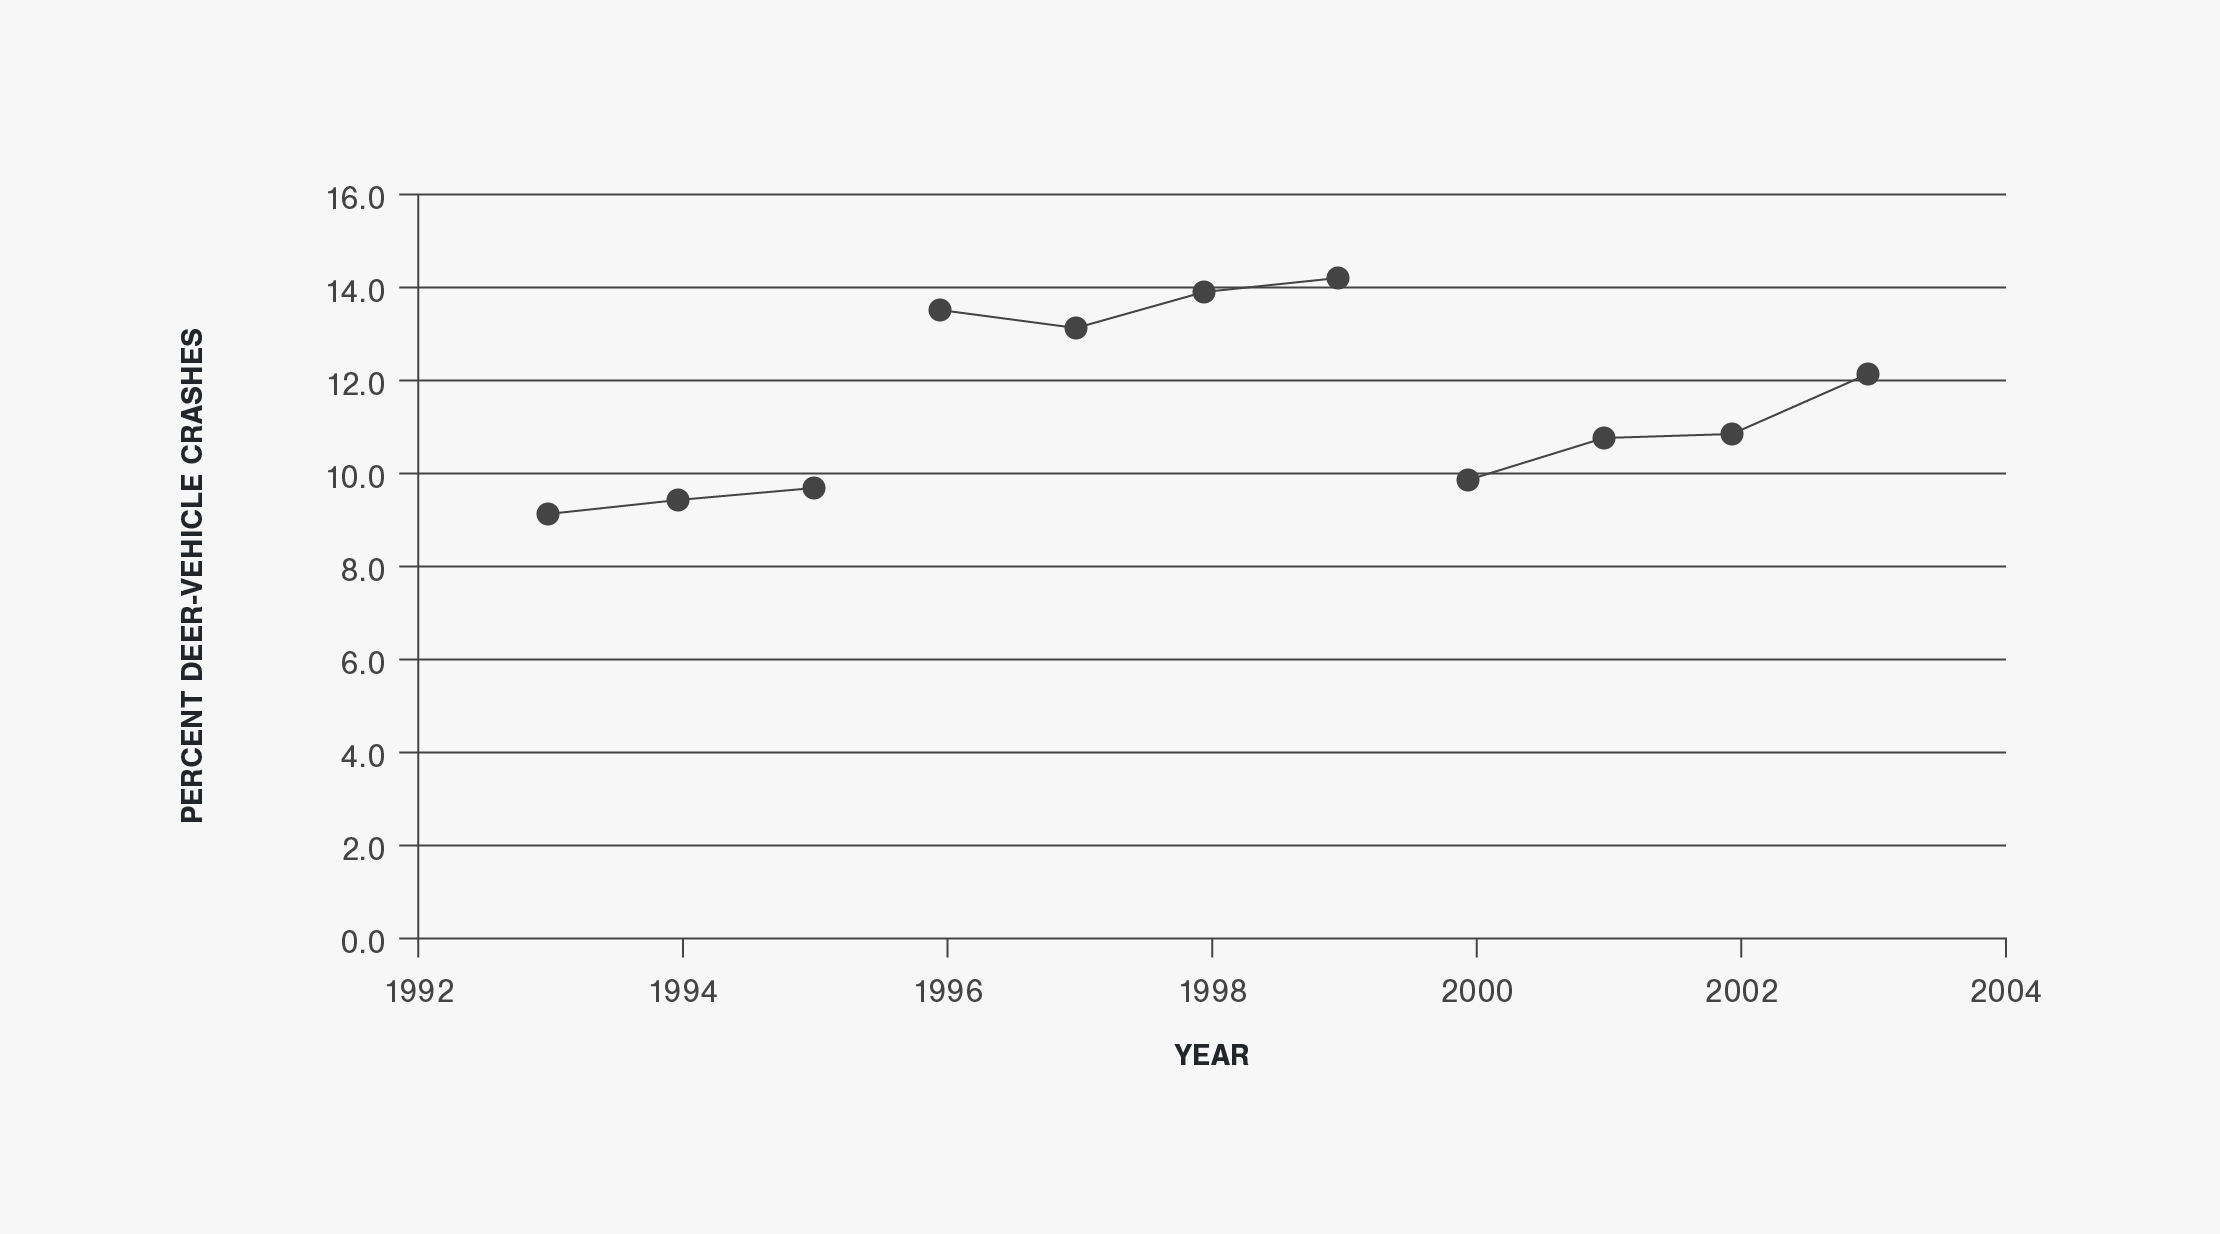
Figure 5 | Number of Deer-Vehicles Crash Fatalities and Injuries in the Upper Midwest (1993 to 2003)
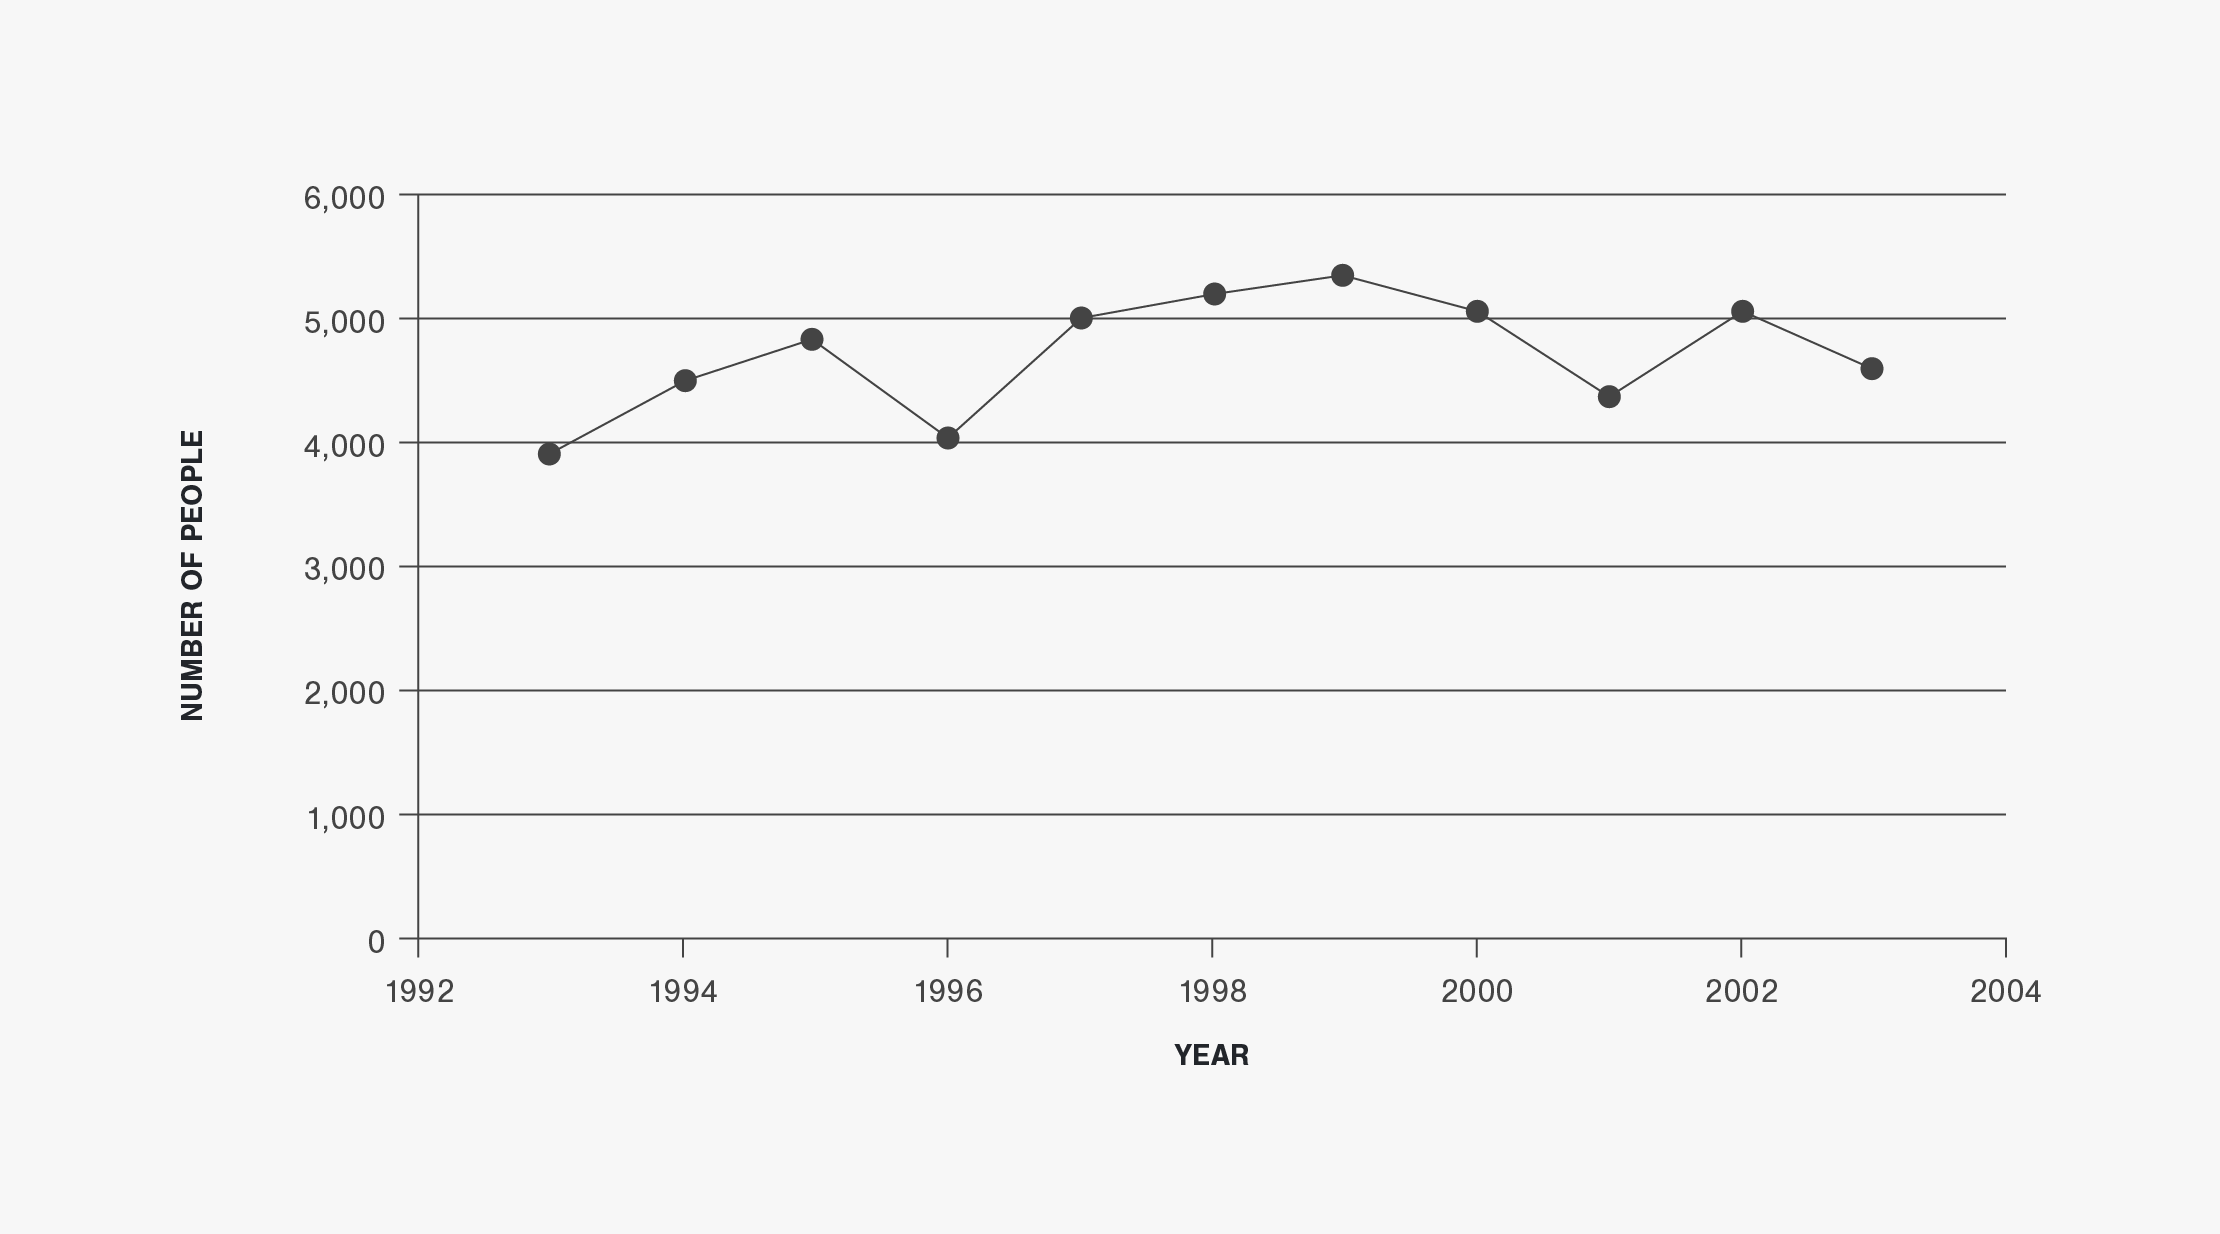
Figure 6 | Deer-Vehicle Crash Rate per 100 Million Vehicle-Miles-Traveled in the Upper Midwest (1993 to 2003)
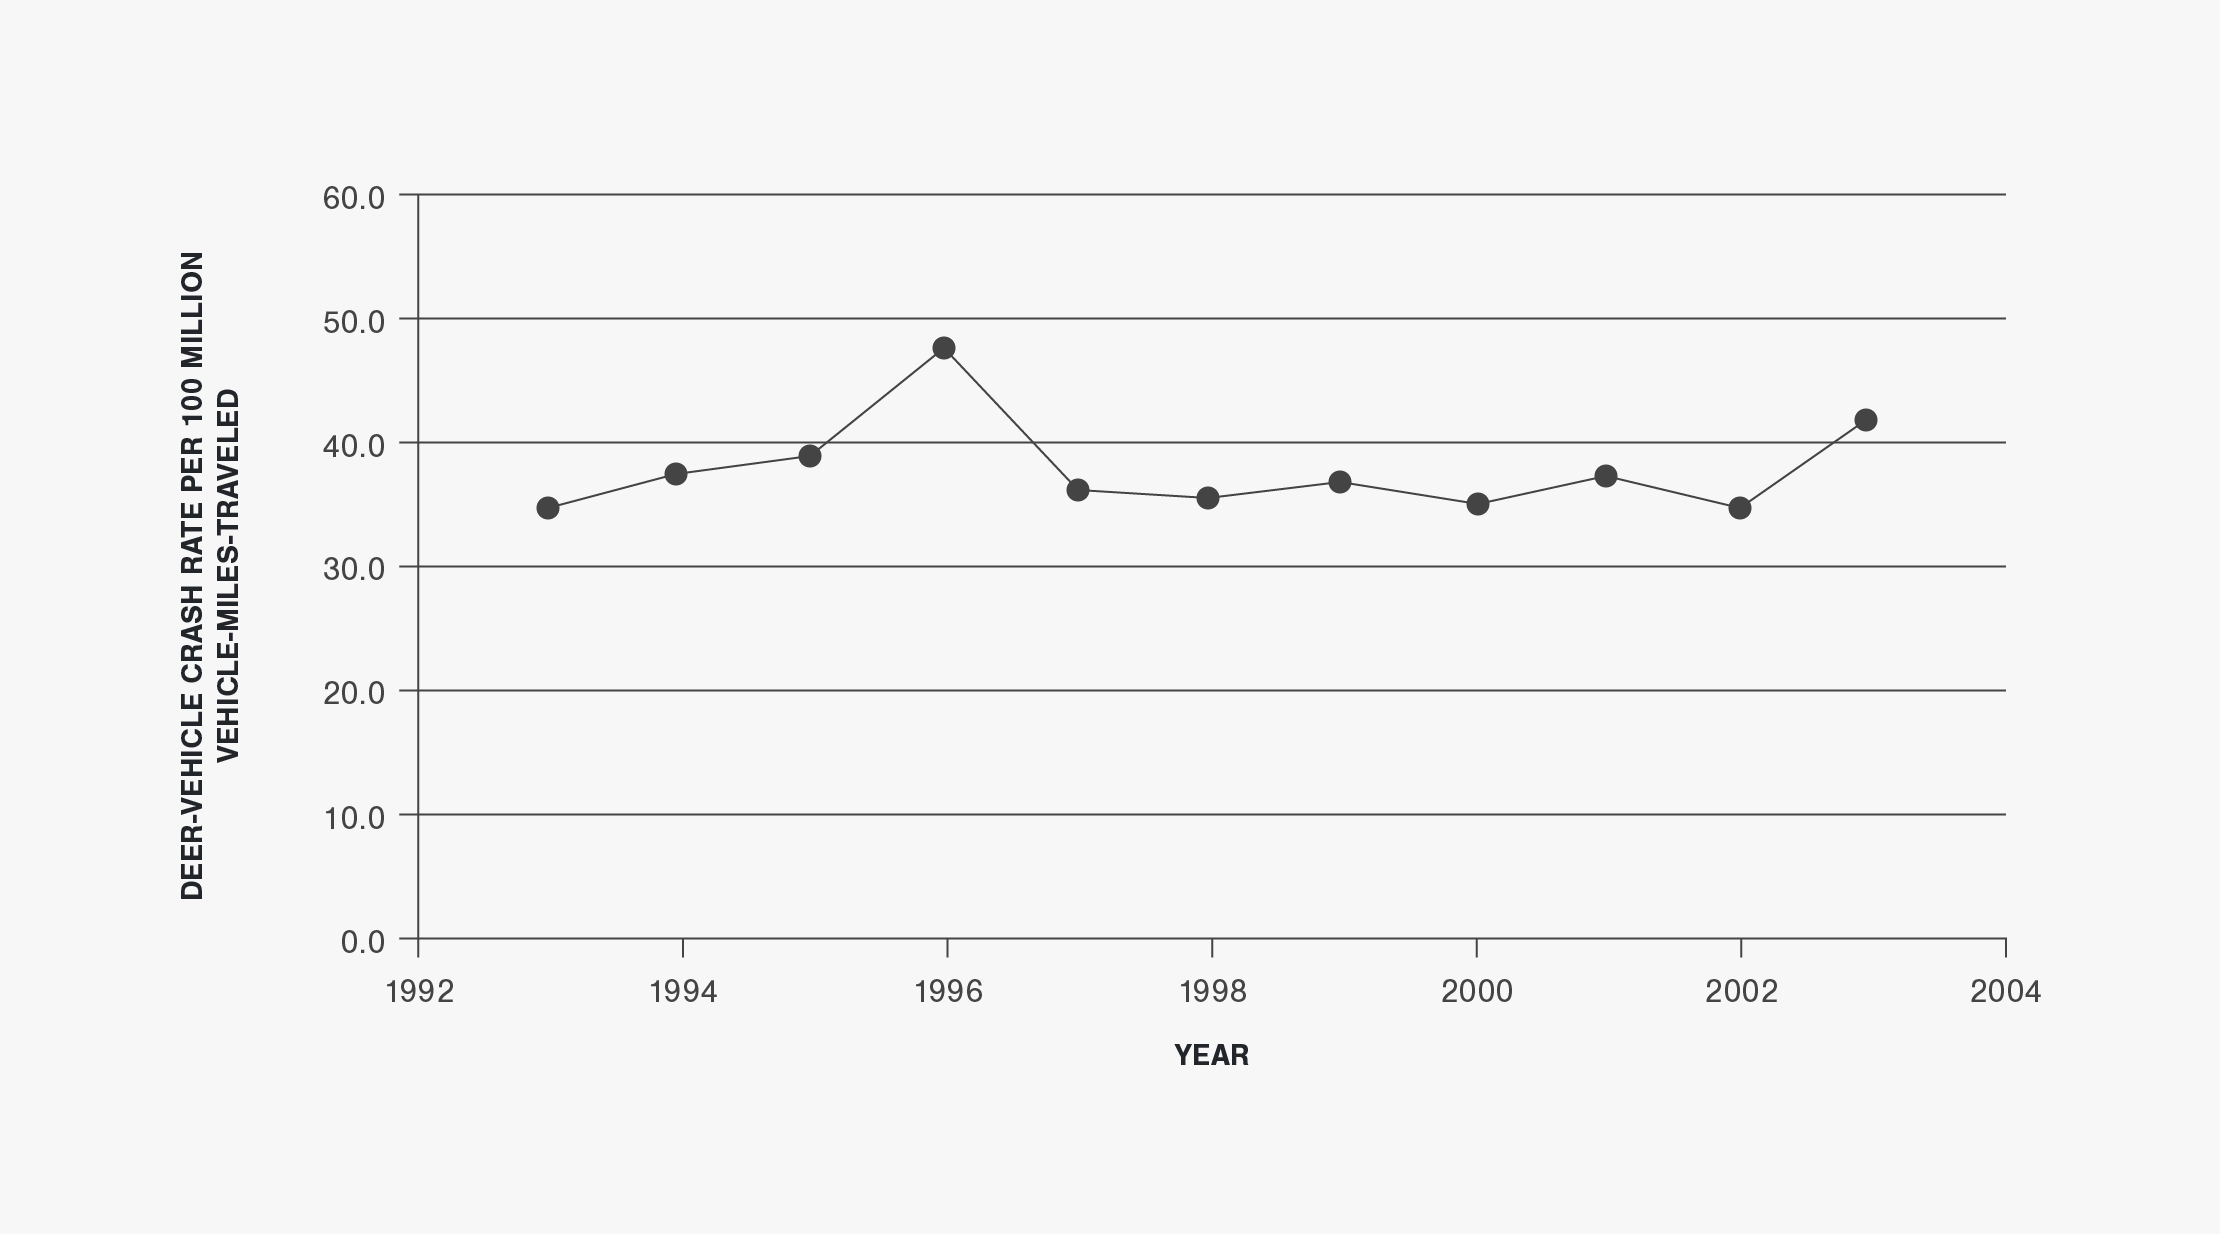
Figure 7 | Pre-Hunt Deer Population Estimates and Deer-Vehicle Crashes in the Upper Midwest (1993 to 2003)
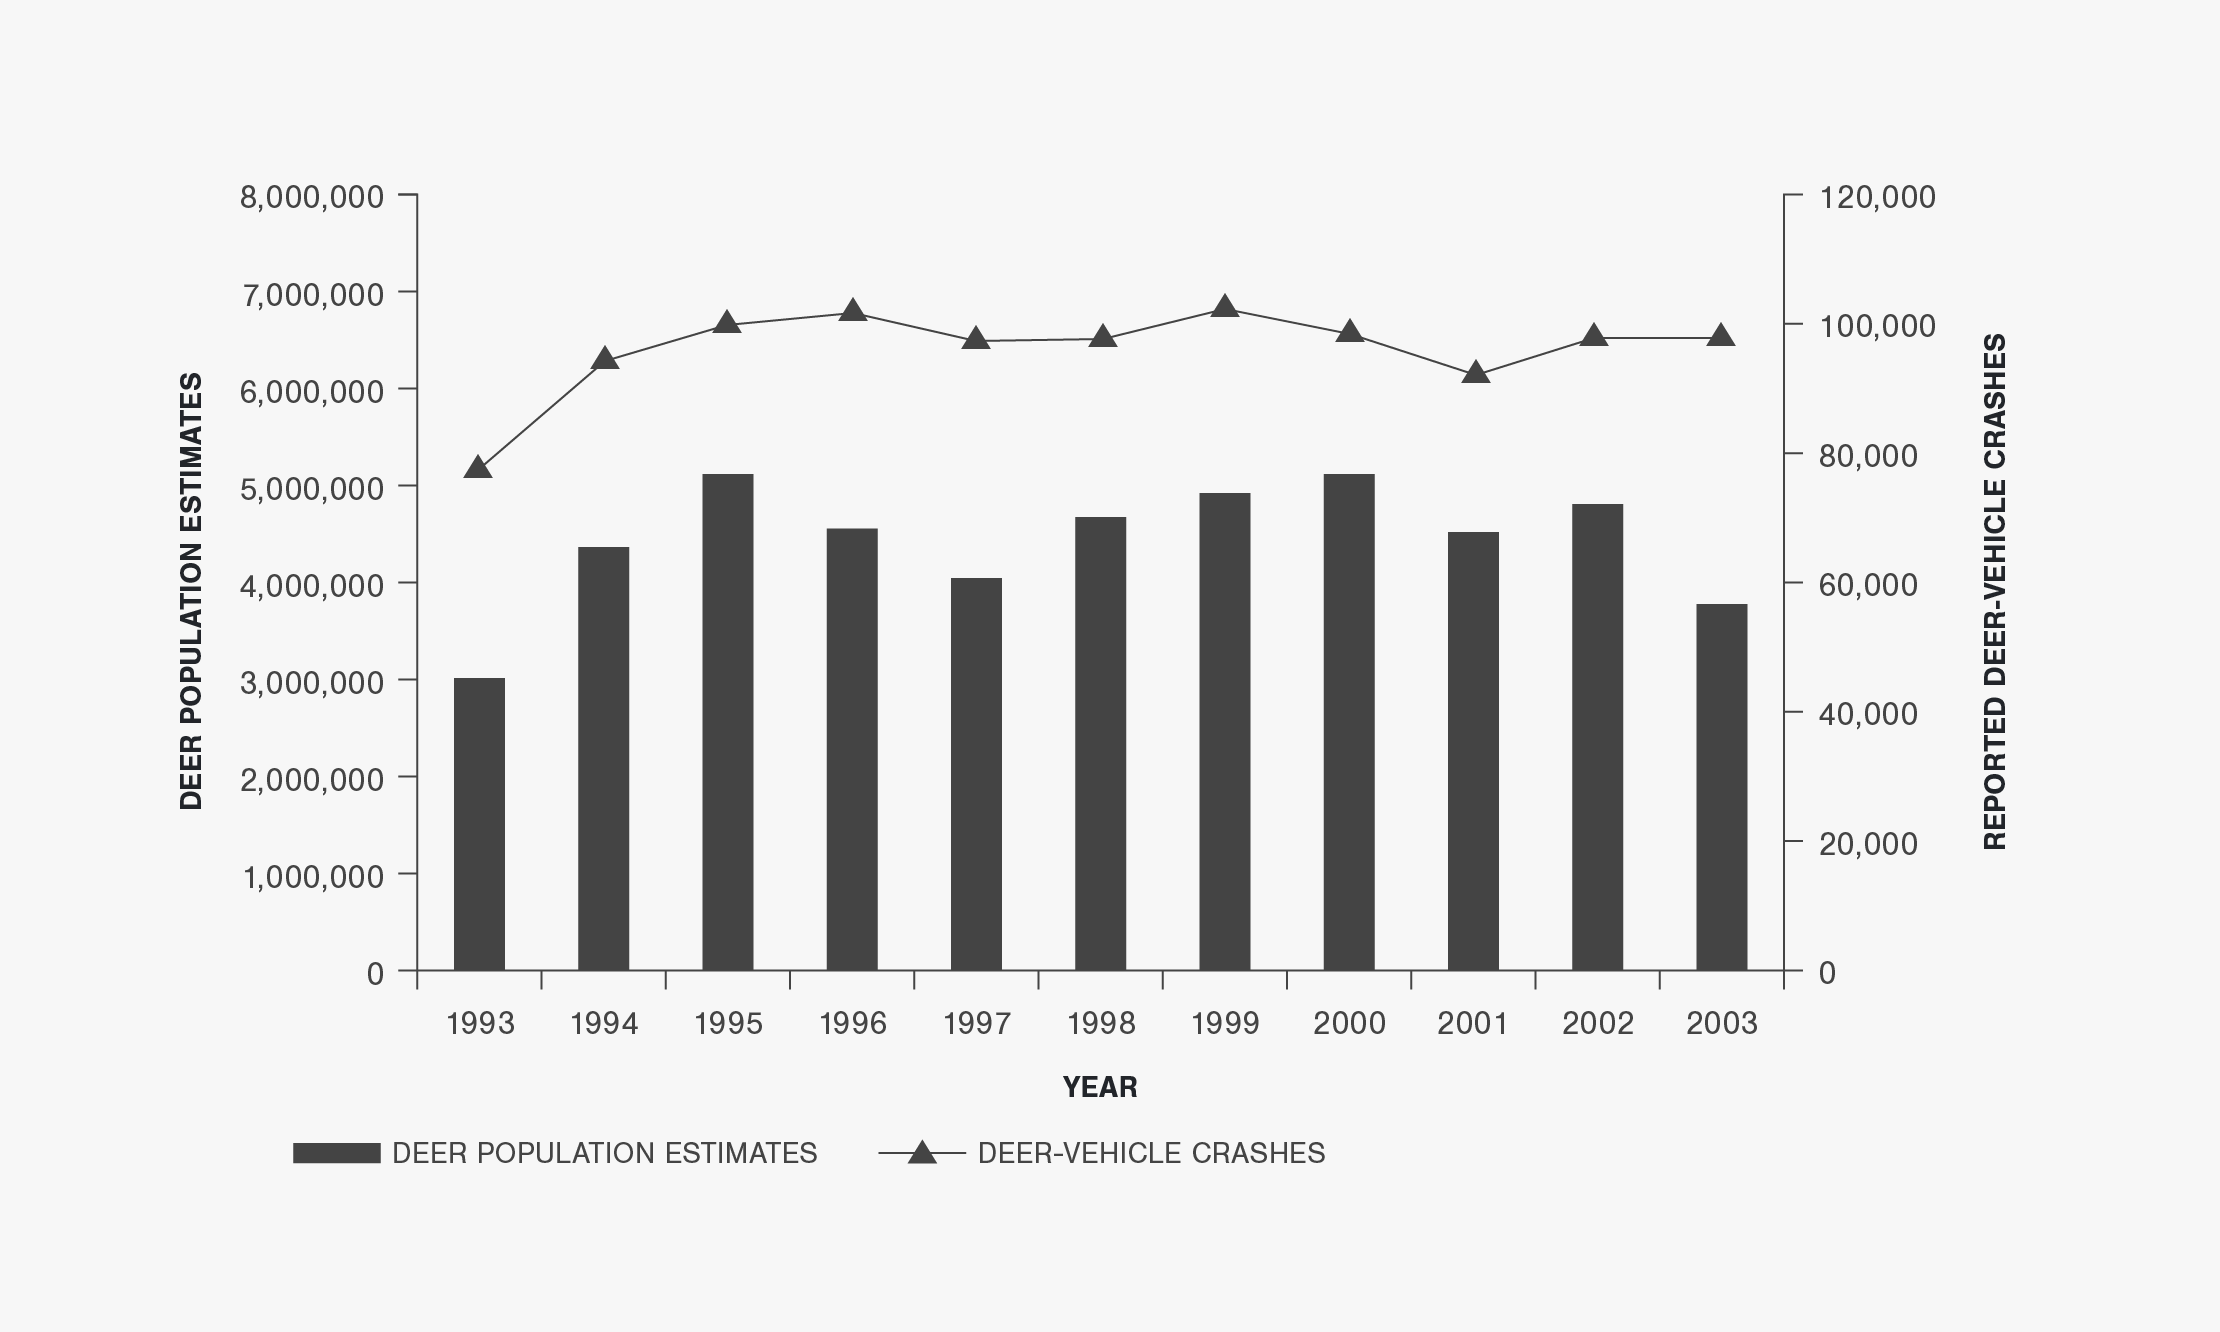
Figure 8 | Roadside Carcass Removals and Reported Deer-Vehicle Crashes in the Upper Midwest (1993 to 2003)
Regional Data Table
Table A-6 | Regional Deer-Vehicle Crash and Related Data (1993 to 2003)
Illinois, Iowa, Michigan, Minnesota, and Wisconsin
a Minimum property damage reporting threshold may differ from state to state and year to year.
b Iowa data is for animal-vehicle crashes.
c Annual rates calculated by combining those states with usable crash data during the year of interest.
d Iowa provided post-hunt estimates. All others are pre-hunt. Illinois provided no estimates.
e Deer carcass data provided by Iowa, Minnesota, and Wisconsin.
f Deer population data for 1993 not provided by Minnesota.
g Minnesota carcass removal data for 1995 excluded due to questions about validity.
h Illinois crash data for 1996 excluded due to inconsistent data summary during that year.
i Illinois crash data for 1996 to 1999 does not include non-fatal crashes within the City of Chicago.
j Iowa crash data for 2001 excluded due to change in safety data management procedures. For comparison purposes the Iowa deer population and carcass data are not included in this table.
k Crash data from Minnesota for 2003 was only available for fatal crashes. For comparison purposes the Minnesota deer population and carcass data are not included in this table.